This website is managed by Ultima Markets’ international entities, and it’s important to emphasise that they are not subject to regulation by the FCA in the UK. Therefore, you must understand that you will not have the FCA’s protection when investing through this website – for example:
You will not be guaranteed Negative Balance Protection
You will not be protected by FCA’s leverage restrictions
You will not have the right to settle disputes via the Financial Ombudsman Service (FOS)
You will not be protected by Financial Services Compensation Scheme (FSCS)
Any monies deposited will not be afforded the protection required under the FCA Client Assets Sourcebook. The level of protection for your funds will be determined by the regulations of the relevant local regulator.
Note: UK clients are kindly invited to visit https://www.ultima-markets.co.uk/. Ultima Markets UK expects to begin onboarding UK clients in accordance with FCA regulatory requirements in 2026.
If you would like to proceed and visit this website, you acknowledge and confirm the following:
1.The website is owned by Ultima Markets’ international entities and not by Ultima Markets UK Ltd, which is regulated by the FCA.
2.Ultima Markets Limited, or any of the Ultima Markets international entities, are neither based in the UK nor licensed by the FCA.
3.You are accessing the website at your own initiative and have not been solicited by Ultima Markets Limited in any way.
4.Investing through this website does not grant you the protections provided by the FCA.
5.Should you choose to invest through this website or with any of the international Ultima Markets entities, you will be subject to the rules and regulations of the relevant international regulatory authorities, not the FCA.
Ultima Markets wants to make it clear that we are duly licensed and authorised to offer the services and financial derivative products listed on our website. Individuals accessing this website and registering a trading account do so entirely of their own volition and without prior solicitation.
By confirming your decision to proceed with entering the website, you hereby affirm that this decision was solely initiated by you, and no solicitation has been made by any Ultima Markets entity.
Ultima Markets does not have an establishment in Singapore and does not operate from Singapore.
Ultima Markets does not provide products or services to citizens or residents of Singapore, and account applications from Singapore citizens or residents will not be accepted.
If you are a citizen or resident of Singapore, please do not open an account or use Ultima Markets’ products or services.
By selecting “Acknowledge and Continue Browsing”, you confirm that you are accessing this website on your own initiative and that your access is not the result of any direct marketing, targeted advertising, solicitation, or promotional activity by Ultima Markets.
Nothing on this website constitutes an offer, solicitation, or promotion of products or services in any jurisdiction where such activity is prohibited. You are responsible for ensuring that your access to and use of this website complies with applicable local laws and regulations.
Discover the best indicators for gold trading, including RSI, MACD, moving averages, ATR and ADX, with some practical XAU/USD examples and tips covered.
Gold can move rapidly when interest-rate expectations, the US dollar, inflation data or geopolitical risk changes. In 2026 alone, spot gold climbed above US 5,500 per ounce in January before falling below US 4,000 in late June, showing how quickly market conditions can shift.
The best indicators for gold trading can help traders make sense of these movements by answering different questions. Is gold trending? Is momentum strengthening? Is volatility increasing? Rather than searching for one perfect signal, traders can combine indicators that measure different parts of the market.
Below are six useful indicators for analysing XAU/USD, together with practical examples of how each can be applied.
Best Gold Trading Indicators at a Glance
Indicator
Main Purpose
Common Setting
Moving Average
Trend direction
20, 50 or 200 periods
RSI
Momentum
14 periods
MACD
Trend and momentum
12, 26, 9
Bollinger Bands
Volatility
20 periods, 2 standard deviations
ATR
Volatility and risk
14 periods
ADX
Trend strength
14 periods
The aim is not to place all six on the chart at once. A trend indicator, momentum indicator and volatility indicator can often provide enough information without making the chart difficult to read.
1. Moving Average
Moving averages smooth out short-term price fluctuations, making the underlying gold trend easier to identify.
A 20-period moving average reacts relatively quickly, while the 50-period average is often used to assess medium-term direction. The 200-period moving average provides a broader view of the market.
How to Use Moving Averages for Gold
When XAU/USD trades consistently above a rising moving average, the trend may be considered bullish. When gold remains below a falling average, the broader structure may be bearish.
Moving averages can also act as dynamic support or resistance during established trends.
For example, gold may rise above the 50 EMA, pull back towards it and then resume higher. Traders can watch the reaction around the moving average rather than treating the line itself as an automatic entry signal.
Real-world example: Gold fell below its 10-month moving average during the sharp June 2026 decline. Reuters noted that the level had been an important longer-term support reference before gold dropped to around US$3,942.
The main limitation is lag. Moving averages confirm trends using past prices, so signals often appear after a move has already started.
2. Relative Strength Index
The Relative Strength Index, or RSI, measures price momentum between 0 and 100.
The standard setting is 14 periods. Readings above 70 are commonly considered overbought, while readings below 30 are considered oversold.
How to Use RSI for Gold
RSI is useful for identifying momentum and potential divergence.
For example, if gold makes a new price high while RSI forms a lower high, bullish momentum may be weakening. This is known as bearish divergence.
However, traders should avoid automatically selling gold whenever RSI moves above 70. During strong trends, RSI can remain overbought for an extended period.
Real-world example: Gold rallied strongly in January 2026, gaining around 14% during the month and recording 12 all-time highs. In a market like this, a high RSI would have reflected powerful momentum rather than necessarily signalling an immediate reversal.
This is why RSI works better when combined with trend structure and support or resistance levels.
3. MACD
Moving Average Convergence Divergence, or MACD, helps traders analyse changes in momentum and trend direction.
The standard MACD settings are 12, 26 and 9.
How to Use MACD for Gold
A bullish signal can occur when the MACD line crosses above the signal line, while a bearish crossover occurs when it moves below.
The histogram can also provide useful information. Expanding bars suggest momentum is strengthening, while shrinking bars may indicate the current move is losing momentum.
MACD tends to be more useful when gold is already trending. During sideways markets, repeated crossovers can produce false signals.
For example, if gold breaks above resistance while the MACD line moves above its signal line and the histogram expands, traders have additional evidence that momentum is supporting the breakout.
4. Bollinger Bands
Bollinger Bands consist of a moving average surrounded by upper and lower bands that adjust according to volatility.
A common setting uses a 20-period moving average with bands two standard deviations away.
How to Use Bollinger Bands for Gold
When the bands become narrow, gold volatility is contracting. This is often called a Bollinger Band squeeze and can occur before a larger price move.
When the bands widen, volatility is increasing.
Gold trading near the upper band does not automatically mean the price should fall. During powerful trends, the market can continue moving alongside the upper or lower band.
Real-world example: Gold moved from above US5,500inJanuary2026tobelowUS4,000 in June. Realised volatility exceeded 50% during part of this period before later falling below 30%. Bollinger Bands could have helped traders recognise these changing volatility conditions.
5. Average True Range
Average True Range, or ATR, measures how much the market is moving rather than whether gold is moving up or down.
A 14-period ATR is a common starting point.
How to Use ATR for Gold
If ATR rises, gold’s trading range is expanding. If ATR falls, price movement is becoming quieter.
ATR can be particularly useful for risk management.
Suppose the daily ATR is US60.AverytightUS10 stop could sit inside normal daily price movement and be triggered by ordinary volatility rather than a genuine change in trend.
Some traders therefore use an ATR multiple when considering stop distance. The important point is that ATR adjusts as gold volatility changes, unlike a fixed stop.
Bollinger Bands and ATR therefore perform different jobs. Bollinger Bands help traders see volatility changing, while ATR can help them adapt risk to that volatility.
6. Average Directional Index
The Average Directional Index, or ADX, measures trend strength rather than direction.
An ADX reading above approximately 25 is commonly associated with a stronger trend, while readings below 20 generally indicate a market with little clear trend.
How to Use ADX for Gold
ADX becomes useful when traders need to decide whether a trend-following strategy makes sense.
Imagine gold breaks above resistance. A rising ADX above 25 may support the view that the new trend is gaining strength. If ADX remains below 20, the breakout may be occurring in a weak or range-bound environment.
ADX does not tell traders whether gold is bullish or bearish. Price structure, moving averages or the directional movement lines are still needed to determine direction.
How to Combine the Best Indicators for Gold Trading
The best indicators for gold trading tend to work better when they measure different things.
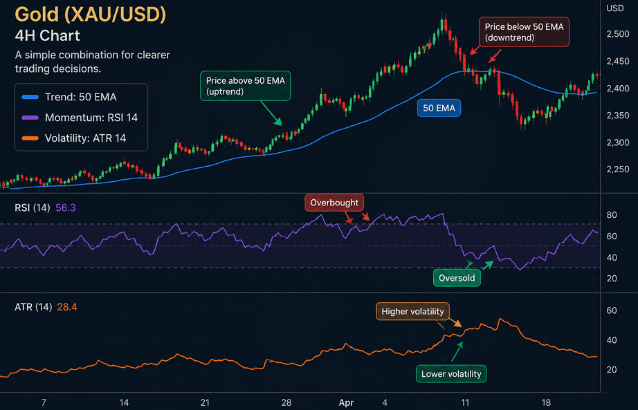
A simple combination could be:
Trend: 50 EMA Momentum: RSI 14 Volatility: ATR 14
Suppose gold is trading above a rising 50 EMA, indicating a broader uptrend. RSI then pulls back towards neutral territory instead of becoming deeply oversold, while ATR shows that volatility remains stable.
Together, these readings provide more context than using RSI, MACD and another momentum oscillator that all provide similar information.
Traders can also analyse a higher timeframe first. A swing trader might identify direction on the daily or four-hour chart before using a shorter timeframe to look for an entry.
Do Gold Indicators Work Without Fundamental Analysis?
Technical indicators show how gold is moving, but they do not always explain why it is moving.
Gold can react strongly to Federal Reserve policy, Treasury yields, inflation, the US dollar and geopolitical uncertainty. The World Gold Council found that momentum, risk factors and foreign exchange movements were among the important contributors to gold’s price variability during the first half of 2026.
A technical signal can be more useful when traders understand the wider market environment.
This is especially relevant for traders who follow gold price movements closely across different sessions. With gold trading 24/7, traders can analyse price action beyond regular weekday hours and continue applying technical indicators when new market conditions develop.
For example, a bearish MACD signal combined with gold falling below a major moving average may deserve more attention if the US dollar and US yields are also rising.
Conclusion
The best indicators for gold trading are not necessarily the most complicated. Moving averages help identify direction, RSI and MACD measure momentum, Bollinger Bands and ATR track volatility, while ADX helps determine whether a trend has enough strength to follow.
Instead of searching for one perfect gold indicator, traders can combine complementary tools and use each for a specific purpose.
Most importantly, the best indicators for gold trading should be used alongside price structure, risk management and awareness of major economic events. No technical indicator can predict the next XAU/USD move with certainty.
FAQ
What is the best indicator for gold trading?
There is no single best indicator. Moving averages, RSI, MACD, ATR and ADX measure different parts of gold price behaviour.
Is RSI good for gold trading?
Yes. RSI can help identify momentum, overbought or oversold conditions and divergence, but it should not be used alone.
Which moving average is best for gold?
The 20, 50 and 200-period moving averages are commonly used depending on the trader’s timeframe and strategy.
What is the best indicator combination for gold?
A moving average for trend, RSI for momentum and ATR for volatility can provide a simple combination of complementary indicators.
Which timeframe is best for gold indicators?
It depends on trading style. Day traders may focus on 15-minute and one-hour charts, while swing traders commonly use four-hour and daily charts.
Share Now
Disclaimer:This content is provided for informational purposes only and does not constitute, and should not be construed as, financial, investment, or other professional advice. No statement or opinion contained herein should be considered a recommendation by Ultima Markets or the author regarding any specific investment product, strategy, or transaction. Readers are advised not to rely solely on this material when making investment decisions and should seek independent advice where appropriate.
Thank you for visiting the Ultima Markets website. Please note that this website is intended for individuals residing in jurisdictions where access is permitted by law. Ultima and its affiliated entities do not operate in your home jurisdiction.
By clicking ‘Acknowledge’, you confirm that you are entering this website solely on your own initiative and not as a result of any specific marketing outreach. You wish to obtain information from this website based on reverse solicitation principles, in accordance with the applicable laws of your home jurisdiction.