This website is managed by Ultima Markets’ international entities, and it’s important to emphasise that they are not subject to regulation by the FCA in the UK. Therefore, you must understand that you will not have the FCA’s protection when investing through this website – for example:
You will not be guaranteed Negative Balance Protection
You will not be protected by FCA’s leverage restrictions
You will not have the right to settle disputes via the Financial Ombudsman Service (FOS)
You will not be protected by Financial Services Compensation Scheme (FSCS)
Any monies deposited will not be afforded the protection required under the FCA Client Assets Sourcebook. The level of protection for your funds will be determined by the regulations of the relevant local regulator.
Note: UK clients are kindly invited to visit https://www.ultima-markets.co.uk/. Ultima Markets UK expects to begin onboarding UK clients in accordance with FCA regulatory requirements in 2026.
If you would like to proceed and visit this website, you acknowledge and confirm the following:
1.The website is owned by Ultima Markets’ international entities and not by Ultima Markets UK Ltd, which is regulated by the FCA.
2.Ultima Markets Limited, or any of the Ultima Markets international entities, are neither based in the UK nor licensed by the FCA.
3.You are accessing the website at your own initiative and have not been solicited by Ultima Markets Limited in any way.
4.Investing through this website does not grant you the protections provided by the FCA.
5.Should you choose to invest through this website or with any of the international Ultima Markets entities, you will be subject to the rules and regulations of the relevant international regulatory authorities, not the FCA.
Ultima Markets wants to make it clear that we are duly licensed and authorised to offer the services and financial derivative products listed on our website. Individuals accessing this website and registering a trading account do so entirely of their own volition and without prior solicitation.
By confirming your decision to proceed with entering the website, you hereby affirm that this decision was solely initiated by you, and no solicitation has been made by any Ultima Markets entity.
Ultima Markets does not have an establishment in Singapore and does not operate from Singapore.
Ultima Markets does not provide products or services to citizens or residents of Singapore, and account applications from Singapore citizens or residents will not be accepted.
If you are a citizen or resident of Singapore, please do not open an account or use Ultima Markets’ products or services.
By selecting “Acknowledge and Continue Browsing”, you confirm that you are accessing this website on your own initiative and that your access is not the result of any direct marketing, targeted advertising, solicitation, or promotional activity by Ultima Markets.
Nothing on this website constitutes an offer, solicitation, or promotion of products or services in any jurisdiction where such activity is prohibited. You are responsible for ensuring that your access to and use of this website complies with applicable local laws and regulations.
Compare the ascending channel vs the ascending triangle patterns. Learn the key difference, structures, and how traders use these bullish chart patterns.
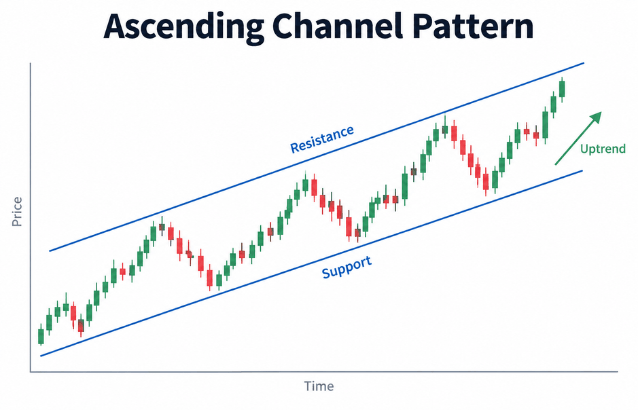
The ascending channel pattern is a popular technical analysis chart pattern used by traders to identify an established uptrend. It shows price moving between two upward-sloping trendlines, with the lower line acting as support and the upper line acting as resistance.
By understanding how an ascending channel forms, traders can identify potential entry areas, profit targets, and signs that a trend may be losing momentum. This pattern is commonly applied across markets including forex, gold, stocks, indices, and cryptocurrencies.
Unlike a simple upward trend, an ascending channel pattern provides a clearer view of how buyers and sellers interact as price moves higher.
What Is an Ascending Channel Pattern?
An ascending channel pattern, or alternatively known as the rising channel pattern forms when price creates a series of higher highs and higher lows while moving within two parallel rising trendlines.
The lower trendline connects a series of higher lows and represents an area where buyers have previously stepped in. The upper trendline connects higher highs and represents an area where selling pressure has appeared.
The pattern shows that buyers remain in control, but sellers continue to create temporary resistance as price moves upward.
For example, if gold rises from $2,300 to $2,400, pulls back to $2,350, then moves higher towards $2,500 before another correction, these repeated movements may create an ascending channel.
The key feature is that both support and resistance move higher together, creating a rising price range.
How Does an Ascending Channel Pattern Form?
An ascending channel develops when market participants gradually push prices higher while still respecting key technical levels.
The formation usually includes three stages:
1. Buyers Create Higher Lows
During an uptrend, buyers enter the market at increasingly higher levels. Each pullback finds support above the previous low, showing continued demand.
2. Sellers Create Temporary Resistance
As price rises, some traders take profits near previous highs. This creates selling pressure around the upper boundary of the channel.
3. Price Continues Moving Between Two Trendlines
When price repeatedly reacts around the upper and lower boundaries, traders can identify a potential ascending channel pattern.
The more times price respects these levels, the more significant the channel may become.
How to Identify an Ascending Channel Pattern
Traders usually look for three important characteristics:
Higher Highs and Higher Lows
The market should show a clear upward structure. If price is moving sideways or creating lower highs, it may not represent an ascending channel.
Two Parallel Rising Trendlines
The support and resistance lines should move upward at a similar angle. The lower line connects swing lows, while the upper line connects swing highs.
Multiple Price Reactions
A stronger ascending channel usually has several touches on both boundaries. These reactions help confirm that traders are paying attention to these levels.
How to Draw an Ascending Channel Pattern
Drawing an ascending channel pattern requires identifying key swing points on the chart.
First, connect at least two higher lows to create the lower support trendline. This line shows where buyers have previously entered.
Next, draw a parallel line above it through the major swing highs. This creates the upper resistance boundary.
A valid channel should contain price movement between both lines. If price constantly breaks through the boundaries, the pattern may not be reliable.
How Traders Use an Ascending Channel Pattern
The ascending channel pattern can be used in several ways depending on a trader’s strategy.
Buying Near Channel Support
Some traders look for potential buying opportunities when price approaches the lower channel boundary.
The idea is that previous buyers may return at similar support levels. However, traders often combine the pattern with additional confirmation tools such as moving averages, RSI, or candlestick signals.
For example, if XAU/USD repeatedly rebounds from the lower channel line during a bullish trend, traders may monitor the area for possible continuation opportunities.
Taking Profit Near Channel Resistance
The upper channel boundary may act as a potential resistance area where price momentum slows.
Some traders watch this level for signs of rejection, such as:
Bearish candlestick patterns
Longer upper wicks
Weakening momentum
Trading Breakouts
Sometimes price breaks outside an ascending channel pattern.
A move above the upper boundary may indicate stronger bullish momentum, while a break below support may suggest that the existing trend is weakening.
However, traders usually wait for confirmation because temporary moves outside the channel can become false breakouts.
Ascending Channel Pattern vs Ascending Triangle
Although both patterns can appear during bullish market conditions, they have different structures.
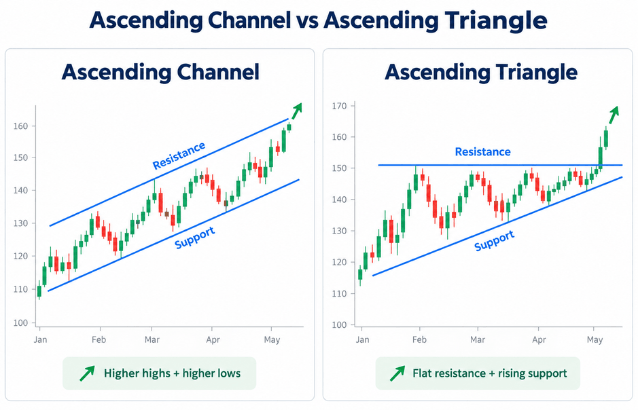
An ascending channel pattern has two rising parallel trendlines, meaning both support and resistance move higher together.
An ascending triangle has a horizontal resistance line and a rising support line. In this pattern, buyers continue pushing price higher while sellers defend the same resistance level.
The main difference is that an ascending channel shows a steady upward movement, while an ascending triangle often shows increasing pressure before a potential breakout.
Ascending Channel Pattern vs Rising Wedge
The ascending channel and rising wedge can look similar because both involve higher highs and higher lows. However, their structures are different.
Feature
Ascending Channel
Rising Wedge
Trendlines
Parallel
Converging
Price movement
Stable upward range
Narrowing upward range
Common interpretation
Trend continuation
Possible trend reversal
An ascending channel reflects an organised uptrend, while a rising wedge may suggest that bullish momentum is slowing.
Common Mistakes
Although the ascending channel pattern can be useful, traders should avoid relying on it alone.
One common mistake is drawing trendlines too early. Two points may not be enough to confirm a reliable channel. Traders often wait for several price reactions before considering the pattern valid.
Another mistake is assuming the pattern will always continue upward. Market conditions can change due to economic data, interest rate decisions, or unexpected events.
For example, gold prices can move sharply when markets react to changes in US dollar strength or central bank expectations. Technical patterns should therefore be combined with broader market analysis and proper risk management.
Using Ascending Channels in Forex and Gold Trading
The ascending channel pattern can be applied across different financial markets.
In forex trading, traders may use it to monitor whether currency pairs such as EUR/USD or GBP/USD continue respecting an upward trend.
In gold trading, the pattern can help traders identify potential pullback areas during bullish periods. If XAU/USD continues forming higher lows while respecting channel support, traders may use the structure to understand market momentum.
However, chart patterns do not predict future price movements with certainty. They are tools that help traders analyse market behaviour and plan possible scenarios.
Conclusion
The ascending channel pattern is a useful technical analysis tool for identifying rising market trends. By showing increasing support and resistance levels, it helps traders understand price structure and potential areas of interest.
Whether used for forex, gold, stocks, or indices, this bullish chart pattern can provide valuable insights into market momentum. Traders should combine it with other forms of analysis and risk management to make more informed decisions.
FAQ
Is an ascending channel pattern bullish?
Yes, an ascending channel pattern is generally considered bullish because it shows higher highs and higher lows. However, price can still break below the channel.
How do you trade an ascending channel pattern?
Traders often look for buying opportunities near channel support, profit-taking areas near resistance, or confirmed breakouts.
What is the difference between an ascending channel and an ascending triangle?
An ascending channel has two rising parallel trendlines, while an ascending triangle has flat resistance and rising support.
Is an ascending channel pattern reliable?
It can help identify market trends, but it should be combined with other indicators and risk management because false signals can occur.
Which indicators work well with an ascending channel pattern?
Common tools include moving averages, RSI, MACD, and volume analysis to confirm momentum and trend strength.
Share Now
Disclaimer:This content is provided for informational purposes only and does not constitute, and should not be construed as, financial, investment, or other professional advice. No statement or opinion contained herein should be considered a recommendation by Ultima Markets or the author regarding any specific investment product, strategy, or transaction. Readers are advised not to rely solely on this material when making investment decisions and should seek independent advice where appropriate.
Thank you for visiting the Ultima Markets website. Please note that this website is intended for individuals residing in jurisdictions where access is permitted by law. Ultima and its affiliated entities do not operate in your home jurisdiction.
By clicking ‘Acknowledge’, you confirm that you are entering this website solely on your own initiative and not as a result of any specific marketing outreach. You wish to obtain information from this website based on reverse solicitation principles, in accordance with the applicable laws of your home jurisdiction.