This website is managed by Ultima Markets’ international entities, and it’s important to emphasise that they are not subject to regulation by the FCA in the UK. Therefore, you must understand that you will not have the FCA’s protection when investing through this website – for example:
You will not be guaranteed Negative Balance Protection
You will not be protected by FCA’s leverage restrictions
You will not have the right to settle disputes via the Financial Ombudsman Service (FOS)
You will not be protected by Financial Services Compensation Scheme (FSCS)
Any monies deposited will not be afforded the protection required under the FCA Client Assets Sourcebook. The level of protection for your funds will be determined by the regulations of the relevant local regulator.
Note: UK clients are kindly invited to visit https://www.ultima-markets.co.uk/. Ultima Markets UK expects to begin onboarding UK clients in accordance with FCA regulatory requirements in 2026.
If you would like to proceed and visit this website, you acknowledge and confirm the following:
1.The website is owned by Ultima Markets’ international entities and not by Ultima Markets UK Ltd, which is regulated by the FCA.
2.Ultima Markets Limited, or any of the Ultima Markets international entities, are neither based in the UK nor licensed by the FCA.
3.You are accessing the website at your own initiative and have not been solicited by Ultima Markets Limited in any way.
4.Investing through this website does not grant you the protections provided by the FCA.
5.Should you choose to invest through this website or with any of the international Ultima Markets entities, you will be subject to the rules and regulations of the relevant international regulatory authorities, not the FCA.
Ultima Markets wants to make it clear that we are duly licensed and authorised to offer the services and financial derivative products listed on our website. Individuals accessing this website and registering a trading account do so entirely of their own volition and without prior solicitation.
By confirming your decision to proceed with entering the website, you hereby affirm that this decision was solely initiated by you, and no solicitation has been made by any Ultima Markets entity.
Hidden divergence in trading shows trend continuation, helping spot entry points using RSI, MACD, and candlestick patterns for smarter market decisions.
What Is A Hidden Divergence
Hidden divergence is a technical analysis signal that helps traders identify trend continuation after a pullback rather than suggesting an outright reversal. It signals that although momentum may briefly weaken, the underlying trend still retains strength and is likely to resume.
This makes hidden divergence particularly valuable for traders who prefer to join or add to trending moves rather than trading counter to them.
In contrast to regular divergence, which often alerts traders that a trend might be ending, hidden divergence suggests the trend is intact and that corrections are simply pauses before continuation.
Continuation vs Reversal Divergence
To truly grasp hidden divergence, it helps to compare it with regular divergence. Regular divergence usually occurs when price and a momentum indicator such as the RSI (Relative Strength Index) or MACD (Moving Average Convergence Divergence) move in opposing directions in a way that suggests fading strength in the trend. This often precedes a trend change.
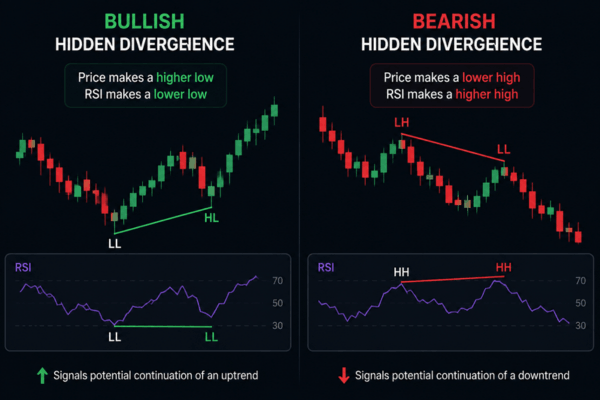
Hidden divergence, by contrast, occurs within a trend correction. In an uptrend, the price makes a higher low while the indicator makes a lower low. In a downtrend, the price makes a lower high while the indicator makes a higher high. This mismatch implies that retracement momentum is not sufficient to overturn the trend.
This is why many traders view hidden divergence as a confirmation signal for trend continuation. It is a signal to stay with the dominant market direction rather than anticipating a reversal too early.
How Do You Identify Hidden Divergence
Spotting hidden divergence usually involves comparing price action with readings from momentum indicators:
Relative Strength Index (RSI)
RSI shows the speed and magnitude of price changes and ranges between 0 and 100. Hidden divergence on RSI typically appears when price retraces within a trend but RSI prints a signal that suggests weak momentum does not reflect trend exhaustion.
Moving Average Convergence Divergence (MACD)
MACD tracks the relationship between moving averages and oscillates around a centre line. Hidden divergence with MACD often indicates that a short‑term slowdown does not disrupt the broader trend. Traders sometimes combine MACD with RSI for added confirmation.
Stochastic Oscillator
This tool compares recent closing prices with a range over a defined period. Hidden divergence in the stochastic tends to confirm that retracements are normal and the trend is poised to resume.
Examples of the Hidden Divergence
Bullish Hidden Divergence
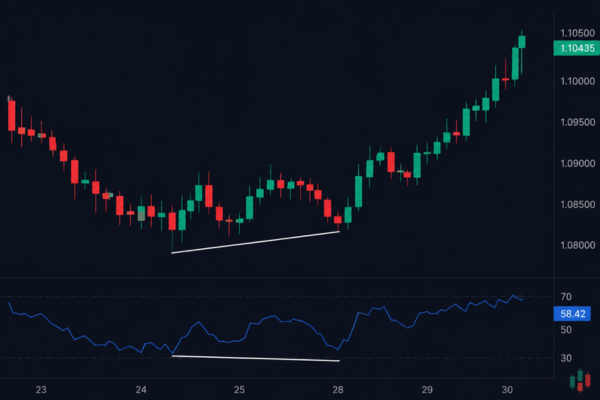
In an uptrend, price makes a higher low but the indicator, such as RSI or MACD, makes a lower low. This suggests that although momentum weakened briefly, the uptrend likely remains intact and could continue to new highs.
Bearish Hidden Divergence
In a downtrend, price makes a lower high while the indicator registers a higher high. This indicates a brief corrective strength that is unlikely to overturn the downtrend and signals continuation.
Investors and chart analysts often look for these patterns across multiple timeframes to validate the hidden divergence signal and increase confidence in the trend continuation.
Using Hidden Divergence in Trading
Hidden divergence works best when combined with a broader strategy and risk management framework:
Confirm the Trend
Before acting on hidden divergence, define the main trend using trendlines, moving averages or higher timeframe structure.
Wait for a Pullback
Look for price retracements that form higher lows in uptrends or lower highs in downtrends. These are the contexts where hidden divergence is typically found.
Combine With Other Tools
Use support and resistance levels, volume analysis, or continuation patterns (such as flags and pennants) to confirm that the trend is still valid.
Manage Risk
Set stop‑loss orders below the most recent swing low in a bullish continuation or above the most recent swing high in a bearish continuation. This limits losses if the trend does not resume as expected.
Limitations of the Hidden Divergence
Although hidden divergence is a powerful trend signal, it has limitations:
False Signals
In range‑bound or choppy markets without a clear trend, hidden divergence can produce misleading signals.
Indicator Lag
Oscillators such as RSI and MACD are based on past data and can lag quick price moves or sudden news events, which can reduce the accuracy of hidden divergence signals.
Not a Standalone Tool
No indicator works perfectly by itself. Traders should use hidden divergence alongside broader price action and technical confirmation to improve results.
Trend Continuation Matters
In the world of technical analysis, hidden divergence is often overshadowed by its more famous relative, regular divergence. However, for trend followers and swing traders, recognising hidden divergence can provide an edge by signalling when a correction is likely just a pause in the main move and not a reversal.
By combining hidden divergence with solid trend definition, other indicators and disciplined risk management, traders can find more timely entries and stay on the right side of strong market moves.
FAQs
What does hidden divergence signal in trading?
It signals that a current trend is likely to continue after a correction rather than reverse.
Which indicators work best for hidden divergence?
RSI, MACD and stochastic oscillators are the most commonly used.
Can hidden divergence be used in all markets?
Yes, it can be applied to forex, stocks, crypto and commodities.
Is hidden divergence reliable on short timeframes?
It can work, but many traders find higher timeframes more reliable for continuation signals.
Share Now
Disclaimer:This content is provided for informational purposes only and does not constitute, and should not be construed as, financial, investment, or other professional advice. No statement or opinion contained herein should be considered a recommendation by Ultima Markets or the author regarding any specific investment product, strategy, or transaction. Readers are advised not to rely solely on this material when making investment decisions and should seek independent advice where appropriate.
Thank you for visiting the Ultima Markets website. Please note that this website is intended for individuals residing in jurisdictions where access is permitted by law. Ultima and its affiliated entities do not operate in your home jurisdiction.
By clicking ‘Acknowledge’, you confirm that you are entering this website solely on your own initiative and not as a result of any specific marketing outreach. You wish to obtain information from this website based on reverse solicitation principles, in accordance with the applicable laws of your home jurisdiction.