This website is managed by Ultima Markets’ international entities, and it’s important to emphasise that they are not subject to regulation by the FCA in the UK. Therefore, you must understand that you will not have the FCA’s protection when investing through this website – for example:
You will not be guaranteed Negative Balance Protection
You will not be protected by FCA’s leverage restrictions
You will not have the right to settle disputes via the Financial Ombudsman Service (FOS)
You will not be protected by Financial Services Compensation Scheme (FSCS)
Any monies deposited will not be afforded the protection required under the FCA Client Assets Sourcebook. The level of protection for your funds will be determined by the regulations of the relevant local regulator.
Note: UK clients are kindly invited to visit https://www.ultima-markets.co.uk/. Ultima Markets UK expects to begin onboarding UK clients in accordance with FCA regulatory requirements in 2026.
If you would like to proceed and visit this website, you acknowledge and confirm the following:
1.The website is owned by Ultima Markets’ international entities and not by Ultima Markets UK Ltd, which is regulated by the FCA.
2.Ultima Markets Limited, or any of the Ultima Markets international entities, are neither based in the UK nor licensed by the FCA.
3.You are accessing the website at your own initiative and have not been solicited by Ultima Markets Limited in any way.
4.Investing through this website does not grant you the protections provided by the FCA.
5.Should you choose to invest through this website or with any of the international Ultima Markets entities, you will be subject to the rules and regulations of the relevant international regulatory authorities, not the FCA.
Ultima Markets wants to make it clear that we are duly licensed and authorised to offer the services and financial derivative products listed on our website. Individuals accessing this website and registering a trading account do so entirely of their own volition and without prior solicitation.
By confirming your decision to proceed with entering the website, you hereby affirm that this decision was solely initiated by you, and no solicitation has been made by any Ultima Markets entity.
Learn the best volatility indicators for trading, including ATR, Bollinger Bands and VIX. Understand market movements to manage trading risks effectively.
Volatility indicators help traders understand how strongly prices are moving in financial markets. By measuring the size and speed of price fluctuations, these tools provide insights into market conditions, potential trading opportunities, and risk management decisions.
Unlike trend indicators that focus on whether prices are moving higher or lower, volatility indicators measure the intensity of market movements. They are widely used by forex, stock, commodity, and cryptocurrency traders to identify periods of high activity, low volatility, and possible market transitions.
Understanding volatility is important because markets constantly change. A calm market can suddenly experience large price movements due to economic data releases, central bank decisions, geopolitical events, or changes in investor sentiment.
This article explains what volatility indicators are, the best volatility indicators used in trading, and how traders can apply them in different market conditions.
What Are Volatility Indicators?
Volatility indicators are technical analysis tools that measure the degree of price movement within a specific period.
When volatility is high, prices tend to move more significantly, creating potentially larger trading opportunities but also increasing risk. When volatility is low, price movements are usually smaller and markets may enter a consolidation phase.
Traders use volatility indicators to answer key questions:
Is market activity increasing or slowing down?
Are price movements larger than usual?
Could a breakout occur after a period of consolidation?
Should risk levels or position sizes be adjusted?
However, volatility indicators do not predict the direction of price movement. Instead, they help traders understand the current market environment and adapt their strategies accordingly.
Why Are Volatility Indicators Important in Trading?
Volatility indicators help traders manage uncertainty and make better-informed decisions.
Financial markets move through different volatility cycles. Periods of low volatility are often followed by stronger price movements, while periods of extreme volatility may create unpredictable conditions.
For example, major economic events such as inflation reports, employment data, and interest rate decisions can quickly increase market volatility. During these periods, traders may use volatility indicators to assess whether price movements are expanding and whether their current strategy remains suitable.
Volatility analysis is also important for risk management. Traders can use volatility measurements to adjust stop loss levels, position sizes, and trading expectations based on current market conditions.
Best Volatility Indicators Used in Trading
Different volatility indicators measure market movement in different ways. Some focus on historical price behaviour, while others reflect expected future volatility.
The most commonly used volatility indicators among traders include:
Average True Range (ATR)
Bollinger Bands
Volatility Index (VIX)
Standard Deviation
Each tool provides different information and can be useful depending on a trader’s strategy and timeframe.
Average True Range (ATR)
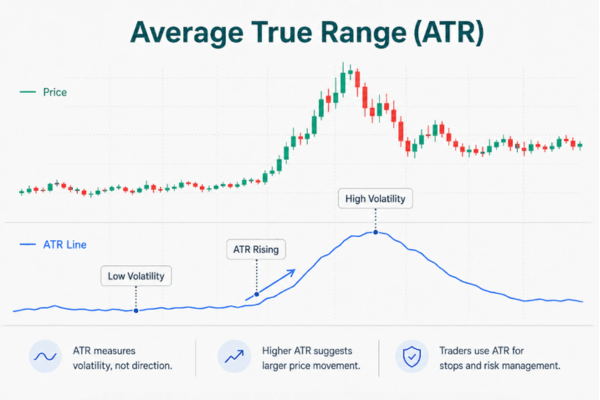
The Average True Range (ATR) is one of the most widely used volatility indicators for measuring price movement.
ATR calculates the average range of price movement over a selected number of periods. It considers the relationship between previous closing prices and current high and low prices to estimate the typical movement of an asset.
A higher ATR reading indicates stronger volatility, while a lower ATR suggests calmer market conditions.
Traders commonly use ATR for:
Setting stop loss levels based on market conditions
Adjusting position sizes according to volatility
Identifying changes in market activity
For example, if a forex pair normally moves 40 pips per day but the ATR increases significantly, traders may expect larger price fluctuations and adjust their risk management approach.
ATR is particularly useful because it adapts to changing market conditions instead of relying on fixed price levels.
Bollinger Bands
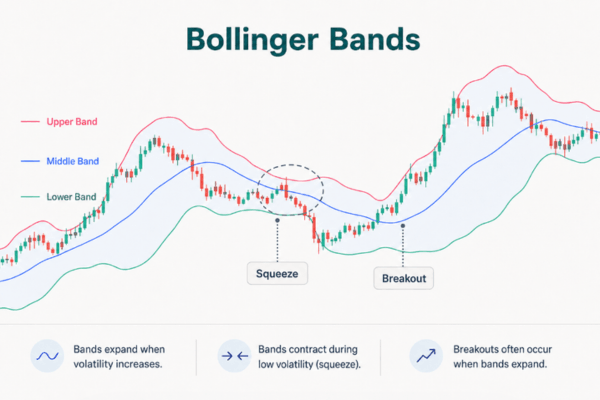
Bollinger Bands are another popular volatility indicator used to measure price expansion and contraction.
The indicator consists of three lines:
A middle band based on a moving average
An upper band showing higher price deviation
A lower band showing lower price deviation
When the bands widen, it suggests volatility is increasing because prices are moving further away from the average. When the bands narrow, it indicates reduced volatility and a possible consolidation phase.
Many traders monitor a pattern known as a Bollinger Band squeeze, where narrowing bands may indicate that a stronger price movement could follow.
However, Bollinger Bands do not show whether the breakout will move upward or downward. Traders often combine them with trend analysis, support and resistance levels, or momentum indicators for additional confirmation.
Volatility Index (VIX)
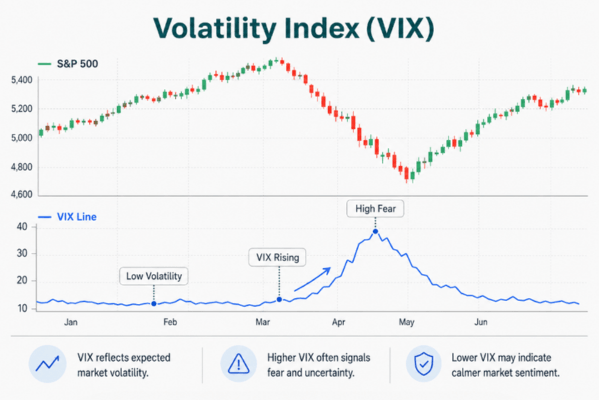
The Volatility Index (VIX) is one of the most recognised measures of market volatility.
Often known as the “fear gauge”, the VIX reflects expected volatility in the US stock market based on options pricing. When investors become concerned about market uncertainty, the VIX often rises as demand for protection increases.
A higher VIX reading generally suggests greater market uncertainty, while a lower reading indicates more stable conditions.
Although the VIX focuses on the S&P 500, traders across different markets monitor it because changes in investor sentiment can influence global stocks, currencies, and commodities.
Standard Deviation
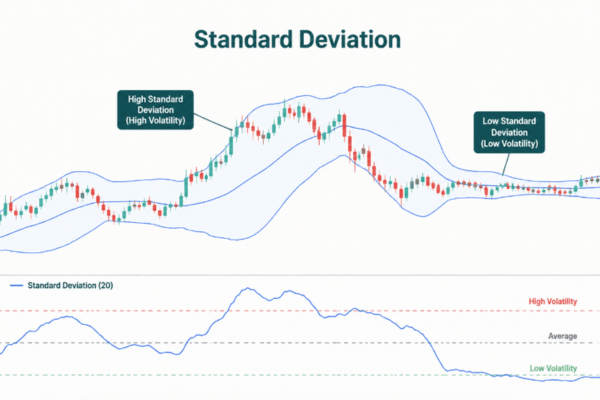
Standard deviation measures how far prices move away from their average value.
A higher standard deviation indicates larger price fluctuations, while a lower reading suggests more stable price behaviour.
This volatility indicator is commonly used within other technical tools, including Bollinger Bands, to measure whether current price movements are unusually large compared with historical levels.
Realised Volatility vs Implied Volatility
Volatility can be measured from two different perspectives: past market movement and future market expectations.
Realised volatility measures actual historical price movements. Indicators such as ATR and standard deviation analyse previous price data to show how much an asset has moved.
Implied volatility reflects the market’s expectation of future price movement. It is commonly associated with options markets and is represented by tools such as the VIX.
Understanding this difference helps traders select the appropriate volatility indicator depending on whether they want to analyse previous market behaviour or future expectations.
ATR vs Bollinger Bands
ATR and Bollinger Bands are two of the most popular volatility tools, but they serve different purposes.
Indicator
Measures
Common Use
ATR
Average price movement range
Stop loss placement and risk management
Bollinger Bands
Price deviation from average
Identifying volatility expansion and possible breakouts
VIX
Expected market volatility
Measuring investor sentiment
Standard Deviation
Historical price variation
Analysing market fluctuations
There is no single best volatility indicator for every trader. ATR may be more suitable for managing risk, while Bollinger Bands may be preferred for identifying changing market conditions.
Many traders combine multiple volatility indicators with other forms of technical analysis to build a more complete trading approach.
How Traders Use Volatility Indicators
Identifying Breakout Opportunities
Low volatility periods often occur before stronger price movements.
When markets enter consolidation, traders may monitor volatility indicators for signs that activity is increasing. For example, expanding Bollinger Bands may suggest that price movement is becoming stronger.
However, increased volatility does not confirm market direction. Traders should combine volatility signals with other analysis methods before making decisions.
Adjusting Risk Management
Volatility plays an important role in managing trading risk.
During periods of high volatility, prices can move quickly and create larger losses if risk is not controlled. Traders may use ATR readings or other volatility measurements to adjust their position size and stop loss distance.
Choosing Trading Strategies
Different volatility environments may require different strategies.
High volatility conditions may provide opportunities for breakout or momentum strategies, while lower volatility markets may be more suitable for range-based approaches.
By understanding market volatility, traders can avoid applying the same strategy in every market condition.
Limitations of Volatility Indicators
Although volatility indicators are useful, they have limitations.
They cannot predict future price direction or guarantee successful trades. A rise in volatility only shows that price movements are becoming larger, not whether the market will move higher or lower.
Volatility can also change rapidly due to unexpected events. Therefore, traders should combine volatility analysis with technical analysis, fundamental research, and proper risk management.
Conclusion
Volatility indicators are valuable tools that help traders understand the strength and speed of market movements.
From ATR and Bollinger Bands to the VIX and standard deviation, these indicators provide insights into changing market conditions, potential opportunities, and risk levels.
While volatility indicators cannot predict market direction, they allow traders to adapt their strategies based on current conditions. By combining volatility analysis with a structured trading plan, traders can make more informed decisions across different financial markets.
Trading involves risk and may lead to capital loss. Profits are not guaranteed.
FAQs
What are volatility indicators used for?
Volatility indicators measure the size of price movements and help traders understand market activity, manage risk, and identify changing conditions.
Which volatility indicator is best for beginners?
ATR and Bollinger Bands are commonly used by beginners because they are simple to understand and can be applied across different markets.
Do volatility indicators predict price direction?
No. Volatility indicators measure the strength of price movement but cannot predict whether prices will rise or fall.
Share Now
Disclaimer:This content is provided for informational purposes only and does not constitute, and should not be construed as, financial, investment, or other professional advice. No statement or opinion contained herein should be considered a recommendation by Ultima Markets or the author regarding any specific investment product, strategy, or transaction. Readers are advised not to rely solely on this material when making investment decisions and should seek independent advice where appropriate.
Thank you for visiting the Ultima Markets website. Please note that this website is intended for individuals residing in jurisdictions where access is permitted by law. Ultima and its affiliated entities do not operate in your home jurisdiction.
By clicking ‘Acknowledge’, you confirm that you are entering this website solely on your own initiative and not as a result of any specific marketing outreach. You wish to obtain information from this website based on reverse solicitation principles, in accordance with the applicable laws of your home jurisdiction.