This website is managed by Ultima Markets’ international entities, and it’s important to emphasise that they are not subject to regulation by the FCA in the UK. Therefore, you must understand that you will not have the FCA’s protection when investing through this website – for example:
You will not be guaranteed Negative Balance Protection
You will not be protected by FCA’s leverage restrictions
You will not have the right to settle disputes via the Financial Ombudsman Service (FOS)
You will not be protected by Financial Services Compensation Scheme (FSCS)
Any monies deposited will not be afforded the protection required under the FCA Client Assets Sourcebook. The level of protection for your funds will be determined by the regulations of the relevant local regulator.
Note: UK clients are kindly invited to visit https://www.ultima-markets.co.uk/. Ultima Markets UK expects to begin onboarding UK clients in accordance with FCA regulatory requirements in 2026.
If you would like to proceed and visit this website, you acknowledge and confirm the following:
1.The website is owned by Ultima Markets’ international entities and not by Ultima Markets UK Ltd, which is regulated by the FCA.
2.Ultima Markets Limited, or any of the Ultima Markets international entities, are neither based in the UK nor licensed by the FCA.
3.You are accessing the website at your own initiative and have not been solicited by Ultima Markets Limited in any way.
4.Investing through this website does not grant you the protections provided by the FCA.
5.Should you choose to invest through this website or with any of the international Ultima Markets entities, you will be subject to the rules and regulations of the relevant international regulatory authorities, not the FCA.
Ultima Markets wants to make it clear that we are duly licensed and authorised to offer the services and financial derivative products listed on our website. Individuals accessing this website and registering a trading account do so entirely of their own volition and without prior solicitation.
By confirming your decision to proceed with entering the website, you hereby affirm that this decision was solely initiated by you, and no solicitation has been made by any Ultima Markets entity.
Learn what an island reversal pattern is. See how its bullish and bearish setups form. Learn how to use this chart to identify potential trend shifts.
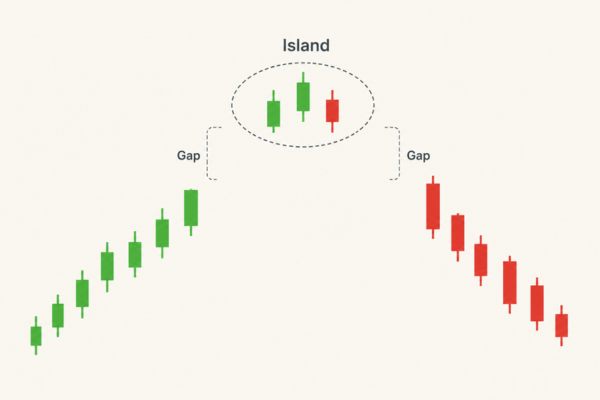
An island reversal is a technical analysis chart pattern that can point to a sudden change in market direction. It forms when a group of candles or price bars is separated from the rest of the chart by price gaps on both sides. Because this isolated section looks like a small island, traders use the pattern to recognise possible shifts in market sentiment.
The pattern often appears after a strong trend. In an uptrend, it may warn that buyers are losing control. In a downtrend, it may suggest that sellers are running out of momentum. However, it should not be treated as a guaranteed buy or sell signal. It works best when read alongside volume, support and resistance, momentum indicators and the wider market context.
What Is an Island Reversal?
An island reversal is a chart formation where a cluster of trading sessions is isolated by two or more gaps. Investopedia describes it as a pattern that can appear on bar or candlestick charts and may indicate a potential reversal from bullish to bearish conditions, or from bearish to bullish conditions.
The key word is “potential”. A clean setup can show that traders have changed their view quickly, but price still needs to follow through. If the second gap is filled almost immediately, the signal becomes much weaker.
How the Pattern Forms
The pattern usually develops in three stages.
First, there is an existing trend. Price may be rising strongly, helped by bullish momentum, or falling sharply as sellers stay in control.
Second, price gaps in the direction of that trend. This first gap often represents an emotional final push. Buyers may rush in after a strong rally, or sellers may panic after a steep fall.
Third, after a short period of isolated trading, price gaps in the opposite direction. This second gap completes the formation and leaves the earlier candles separated from the surrounding price action.
A useful way to understand the structure is through gap psychology. The first gap can act like an exhaustion gap, while the second can behave like a breakaway gap in the new direction. The LBMA’s technical analysis guide explains that the reversal is confirmed by the breakaway gap, with the isolated trading period showing a clear shift in sentiment.
Bullish and Bearish Island Reversal Patterns
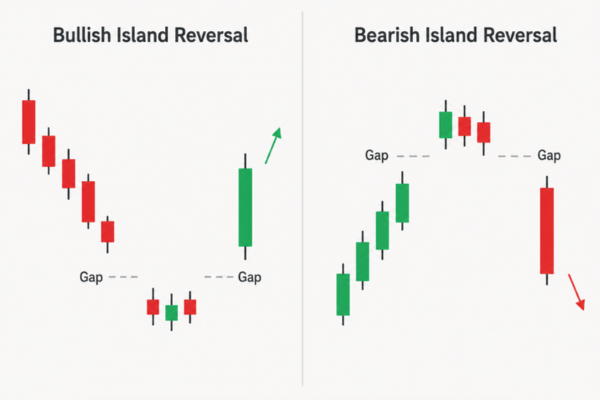
A bullish island reversal forms after a downtrend. Price gaps lower, trades in a narrow isolated range, and then gaps higher. This suggests that selling pressure may be fading and that buyers are starting to regain control. The signal is often stronger when it appears near support or when momentum indicators begin to improve.
A bearish island reversal forms after an uptrend. Price gaps higher, trades in an isolated range, and then gaps lower. This can suggest that a rally is losing strength and that late buyers are trapped above the current market price. If those buyers sell to reduce losses, their selling can add pressure to the reversal.
Key Characteristics of a Valid Pattern
A stronger setup usually has a visible trend before the pattern, a gap in the direction of that trend, a compact island of price action, a second gap in the opposite direction, little or no overlap with nearby candles, and higher volume near the gaps.
Volume matters because it can show whether the reversal has broad participation. TradingSim notes that rising volume on both the first gap and the later opposite gap is a key sign of a valid pattern.
The cleaner the gaps, the easier the pattern is to recognise. If candle wicks overlap heavily, or if price quickly fills the second gap, the setup becomes less convincing.
Why Traders Watch This Pattern
Traders watch this pattern because it can reveal trapped positioning. In a bearish setup, late buyers may be stuck on the island after price gaps down. In a bullish setup, short sellers may be trapped after price gaps higher. This sudden change can create urgency, which is why follow-through can sometimes be sharp.
Even so, the pattern is best used as a warning sign that the trend may be changing, not as a standalone trading instruction. Traders often wait for confirmation from support and resistance, moving averages, RSI, MACD, or a clear break in market structure.
How Reliable Is the Pattern?
The pattern looks dramatic, but its performance is mixed. Thomas Bulkowski’s PatternSite data reports that island bottoms ranked 38 out of 39 for upward breakouts in bull markets, while island tops ranked 31 out of 36 for downward breakouts. The same data lists break-even failure rates of 31% for island bottoms and 34% for island tops, based on more than 2,000 perfect trades.
This does not mean the pattern is useless. It means traders should avoid treating it as a magic signal. A more balanced approach is to use it with other evidence, especially volume, support and resistance, and follow-through in the new direction.
What Invalidates the Pattern?
The setup becomes weaker when price moves back into the gap area or closes inside the island range. If the second gap is filled quickly, the island is no longer clearly separated from the rest of the chart.
Traders may also question the pattern if there was no clear trend before the first gap, if volume is weak, or if it appears in a messy sideways market.
Island Reversal vs Abandoned Baby
This pattern is sometimes confused with the abandoned baby candlestick pattern. Both involve isolated price action between gaps, but they are not the same.
An abandoned baby is usually a stricter three-candle pattern, often with a doji in the middle. The island setup is broader. It can contain one candle, several candles, or a longer consolidation period.
Conclusion
The island reversal is a clear chart pattern that can signal a sharp change in market sentiment. It forms when price gaps in the direction of an existing trend, trades in an isolated range, and then gaps in the opposite direction.
A bullish version may point to a possible bottom, while a bearish version may warn of a possible top. Still, the pattern is not foolproof. For better analysis, traders should look for clean gaps, stronger volume, support or resistance, and confirmation from other indicators before acting on the signal.
FAQs
Is an island reversal bullish or bearish?
It can be either. A bullish version forms after a downtrend, while a bearish version forms after an uptrend.
Is the pattern reliable?
It can be useful, but not on its own. Confirmation from volume, price action and other indicators is important.
What confirms it?
The second gap confirms the basic structure. Strong volume and follow-through make it more convincing.
What makes the pattern fail?
It weakens if price quickly fills the second gap or closes back inside the island range.
Share Now
Disclaimer:This content is provided for informational purposes only and does not constitute, and should not be construed as, financial, investment, or other professional advice. No statement or opinion contained herein should be considered a recommendation by Ultima Markets or the author regarding any specific investment product, strategy, or transaction. Readers are advised not to rely solely on this material when making investment decisions and should seek independent advice where appropriate.
Thank you for visiting the Ultima Markets website. Please note that this website is intended for individuals residing in jurisdictions where access is permitted by law. Ultima and its affiliated entities do not operate in your home jurisdiction.
By clicking ‘Acknowledge’, you confirm that you are entering this website solely on your own initiative and not as a result of any specific marketing outreach. You wish to obtain information from this website based on reverse solicitation principles, in accordance with the applicable laws of your home jurisdiction.