This website is managed by Ultima Markets’ international entities, and it’s important to emphasise that they are not subject to regulation by the FCA in the UK. Therefore, you must understand that you will not have the FCA’s protection when investing through this website – for example:
You will not be guaranteed Negative Balance Protection
You will not be protected by FCA’s leverage restrictions
You will not have the right to settle disputes via the Financial Ombudsman Service (FOS)
You will not be protected by Financial Services Compensation Scheme (FSCS)
Any monies deposited will not be afforded the protection required under the FCA Client Assets Sourcebook. The level of protection for your funds will be determined by the regulations of the relevant local regulator.
Note: UK clients are kindly invited to visit https://www.ultima-markets.co.uk/. Ultima Markets UK expects to begin onboarding UK clients in accordance with FCA regulatory requirements in 2026.
If you would like to proceed and visit this website, you acknowledge and confirm the following:
1.The website is owned by Ultima Markets’ international entities and not by Ultima Markets UK Ltd, which is regulated by the FCA.
2.Ultima Markets Limited, or any of the Ultima Markets international entities, are neither based in the UK nor licensed by the FCA.
3.You are accessing the website at your own initiative and have not been solicited by Ultima Markets Limited in any way.
4.Investing through this website does not grant you the protections provided by the FCA.
5.Should you choose to invest through this website or with any of the international Ultima Markets entities, you will be subject to the rules and regulations of the relevant international regulatory authorities, not the FCA.
Ultima Markets wants to make it clear that we are duly licensed and authorised to offer the services and financial derivative products listed on our website. Individuals accessing this website and registering a trading account do so entirely of their own volition and without prior solicitation.
By confirming your decision to proceed with entering the website, you hereby affirm that this decision was solely initiated by you, and no solicitation has been made by any Ultima Markets entity.
Discover the difference between EMA vs SMA. See how the exponential and simple moving averages work. Read to learn which moving average traders will use.
Moving averages are among the most widely used technical indicators in trading. By calculating the average price of an asset over a specific period, they help traders identify whether a market is trending higher, trending lower, or moving sideways.
Moving averages can also help traders analyse momentum and identify potential support and resistance levels. Two of the most commonly used types are the Simple Moving Average (SMA) and Exponential Moving Average (EMA).
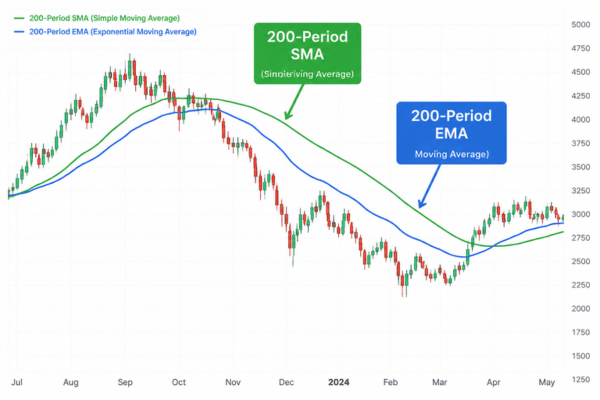
When comparing EMA vs SMA, the key difference lies in how each indicator calculates and weighs price data. SMA gives equal importance to all prices within a selected period, while EMA gives greater weight to recent price movements, allowing it to respond faster to market changes.
Both indicators have their own advantages and limitations. The right choice depends on a trader’s strategy, timeframe, and approach to analysing market trends.
What Is a Simple Moving Average (SMA)?
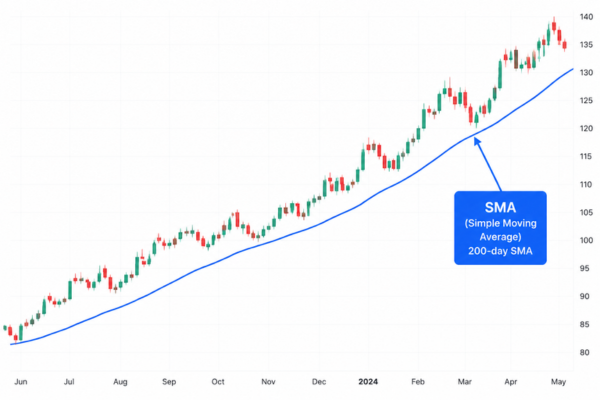
A Simple Moving Average (SMA) calculates the average closing price of an asset over a specific number of periods.
The formula is:
SMA = Sum of closing prices ÷ Number of periods
For example, a 10-day SMA adds the closing prices from the last 10 trading days and divides the total by 10. Each price point receives equal importance in the calculation.
The easiest way to understand SMA is that every price period gets an equal “vote”. A closing price from 10 days ago has the same influence as yesterday’s closing price.
Because SMA gives equal weighting to all data points, it creates a smoother line that reduces short-term market noise. This makes it useful for traders who want to understand broader market trends without reacting too quickly to temporary price movements.
Common SMA settings include:
50-day SMA: Often used to identify medium-term market trends
100-day SMA: Used to monitor broader price direction
200-day SMA: A widely followed long-term trend indicator, especially in stock markets
What Is an Exponential Moving Average (EMA)?
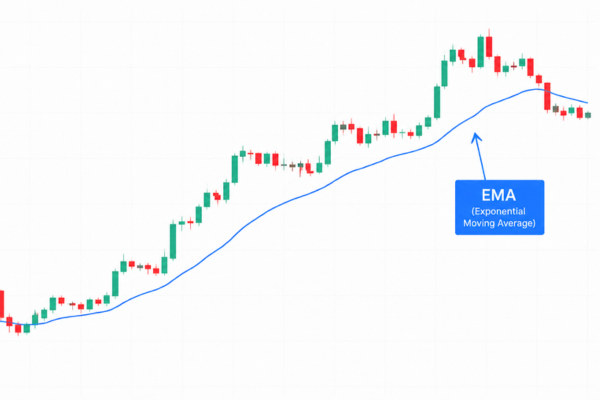
An Exponential Moving Average (EMA) is a moving average that gives greater importance to recent price data.
Unlike SMA, where all prices receive equal weighting, EMA uses an exponential calculation that allows newer prices to have a stronger influence while older data gradually becomes less significant.
In simple terms, EMA gives recent market activity a louder “voice”. This allows it to adjust more quickly when price momentum changes.
For example, if a stock or currency pair suddenly moves higher, the EMA will rise faster than the SMA because recent price changes have a greater impact on the calculation.
Common EMA settings include:
9 EMA: Often used by short-term traders to track quick momentum changes
20 EMA: Popular among swing traders
50 EMA: Used to analyse medium-term momentum
Because EMA reacts faster to new price movements, it can help traders identify possible trend changes earlier. However, this increased sensitivity can also make EMA more vulnerable to false signals.
Key Differences of EMA vs SMA
The main difference between EMA vs SMA comes down to calculation method, price weighting, and sensitivity to market movements.
Difference
SMA
EMA
Calculation method
Calculates the average price over a selected period
Uses weighted calculation that prioritises recent prices
Price weighting
All prices have equal importance
Recent prices have greater influence
Reaction speed
Slower response to price changes
Faster response to price changes
Sensitivity
Less affected by short-term fluctuations
More sensitive to market movements
Trading signals
More stable but may appear later
Earlier signals but may create more false signals
Common use
Long-term trend analysis
Short-term trading and momentum analysis
A simple way to remember the difference is:
SMA is smoother but slower, while EMA is faster but more sensitive to short-term price changes.
SMA can help traders filter out market noise, while EMA allows traders to react more quickly when momentum starts shifting.
How Traders Use EMA and SMA in Trading
Moving averages are not only used to identify trends. Traders also use them to analyse momentum, confirm market direction, and find potential trading opportunities.
Identifying Market Trends
One of the most common uses of moving averages is identifying whether a market is trending upward or downward.
For example:
Price trading above a moving average may indicate stronger bullish momentum
Price trading below a moving average may suggest weaker market conditions
Long-term traders often monitor the 200-day SMA to understand the overall market trend, while short-term traders may use EMA settings to track faster price movements.
However, moving averages are backward-looking indicators because they rely on previous price data. They help traders confirm existing trends rather than predict future market movements.
Using Moving Average Crossovers
Moving average crossover strategies compare two moving averages with different periods to identify possible trend changes.
A bullish crossover occurs when a shorter moving average moves above a longer moving average. This may suggest that recent momentum is becoming stronger.
For example:
50 EMA crossing above 200 SMA
This may indicate improving short-term momentum compared with the longer-term trend.
A bearish crossover occurs when a shorter moving average moves below a longer moving average, which may suggest weakening momentum.
However, crossover signals can sometimes be delayed because moving averages react after price movements have already started.
Using Moving Averages as Support and Resistance
Moving averages can also act as dynamic support and resistance levels.
During an uptrend, price may pull back towards a moving average before continuing higher. Traders may watch these areas to see whether buyers continue defending the trend.
For example, the 50-day SMA and 200-day SMA are closely followed by many market participants. When many traders monitor the same levels, these moving averages can sometimes influence market behaviour.
However, moving averages are not fixed support or resistance levels. Strong market movements can push prices above or below these indicators.
Which Moving Average Should Traders Use?
There is no single moving average that is best for every trader. The choice between EMA and SMA depends on trading style, timeframe, and risk tolerance.
When Traders Use EMA
EMA is often preferred by short-term traders because it responds quickly to recent price movements.
Advantages of EMA:
Provides faster signals
Helps identify momentum changes earlier
Useful for short-term and swing trading strategies
However, the faster reaction comes with a trade-off. EMA can produce more false signals during volatile or sideways markets.
This is known as a whipsaw, where price moves in one direction, triggers a trading signal, and then quickly reverses.
When Traders Use SMA
SMA is commonly preferred by traders who want a smoother view of market trends.
Advantages of SMA:
Reduces short-term market noise
Provides more stable signals
Useful for longer-term trend analysis
The downside is that SMA reacts more slowly because older price data has the same influence as recent prices.
Popular EMA and SMA Settings for Different Trading Styles
Different traders use different moving average settings depending on their objectives.
Trading Style
Common Moving Average Settings
Scalping
9 EMA, 20 EMA
Day trading
20 EMA, 50 EMA
Swing trading
50 EMA, 50 SMA
Long-term investing
200 SMA
These settings are not fixed rules. Traders often adjust moving averages based on the asset, market conditions, and their trading strategy.
Limitations of Using Moving Averages
Although EMA and SMA are valuable technical analysis tools, they have limitations.
First, both indicators rely on historical price data, meaning they cannot predict future market movements.
Second, moving averages may perform poorly in ranging markets. When prices move sideways, they can frequently cross above and below the indicator, creating confusing signals.
For this reason, many traders combine moving averages with other tools such as RSI, MACD, volume analysis, and support and resistance levels.
Conclusion
Understanding EMA vs SMA can help traders choose a moving average that matches their trading approach.
SMA provides a smoother and more stable view of market trends, making it useful for longer-term analysis. EMA reacts faster to recent price movements, making it popular among traders who want quicker signals.
Neither indicator is automatically better than the other. SMA may suit traders who prefer stability, while EMA may be more suitable for those who want faster responses to market changes.
By understanding the strengths and limitations of both moving averages, traders can use EMA and SMA more effectively when analysing market conditions.
FAQs
Is EMA better than SMA?
EMA is not necessarily better than SMA. EMA reacts faster to price changes, while SMA provides smoother and more stable signals.
Which moving average is best for beginners?
SMA is often easier for beginners because it provides clearer signals with less sensitivity to short-term price movements.
Can EMA and SMA be used together?
Yes. Many traders combine EMA and SMA to compare short-term momentum with longer-term market trends.
Share Now
Disclaimer:This content is provided for informational purposes only and does not constitute, and should not be construed as, financial, investment, or other professional advice. No statement or opinion contained herein should be considered a recommendation by Ultima Markets or the author regarding any specific investment product, strategy, or transaction. Readers are advised not to rely solely on this material when making investment decisions and should seek independent advice where appropriate.
Thank you for visiting the Ultima Markets website. Please note that this website is intended for individuals residing in jurisdictions where access is permitted by law. Ultima and its affiliated entities do not operate in your home jurisdiction.
By clicking ‘Acknowledge’, you confirm that you are entering this website solely on your own initiative and not as a result of any specific marketing outreach. You wish to obtain information from this website based on reverse solicitation principles, in accordance with the applicable laws of your home jurisdiction.