This website is managed by Ultima Markets’ international entities, and it’s important to emphasise that they are not subject to regulation by the FCA in the UK. Therefore, you must understand that you will not have the FCA’s protection when investing through this website – for example:
You will not be guaranteed Negative Balance Protection
You will not be protected by FCA’s leverage restrictions
You will not have the right to settle disputes via the Financial Ombudsman Service (FOS)
You will not be protected by Financial Services Compensation Scheme (FSCS)
Any monies deposited will not be afforded the protection required under the FCA Client Assets Sourcebook. The level of protection for your funds will be determined by the regulations of the relevant local regulator.
Note: UK clients are kindly invited to visit https://www.ultima-markets.co.uk/. Ultima Markets UK expects to begin onboarding UK clients in accordance with FCA regulatory requirements in 2026.
If you would like to proceed and visit this website, you acknowledge and confirm the following:
1.The website is owned by Ultima Markets’ international entities and not by Ultima Markets UK Ltd, which is regulated by the FCA.
2.Ultima Markets Limited, or any of the Ultima Markets international entities, are neither based in the UK nor licensed by the FCA.
3.You are accessing the website at your own initiative and have not been solicited by Ultima Markets Limited in any way.
4.Investing through this website does not grant you the protections provided by the FCA.
5.Should you choose to invest through this website or with any of the international Ultima Markets entities, you will be subject to the rules and regulations of the relevant international regulatory authorities, not the FCA.
Ultima Markets wants to make it clear that we are duly licensed and authorised to offer the services and financial derivative products listed on our website. Individuals accessing this website and registering a trading account do so entirely of their own volition and without prior solicitation.
By confirming your decision to proceed with entering the website, you hereby affirm that this decision was solely initiated by you, and no solicitation has been made by any Ultima Markets entity.
Learn how the Gartley pattern works, including Fibonacci ratios, bullish and bearish setups, entry rules, stop-loss placement, targets and trading risks.
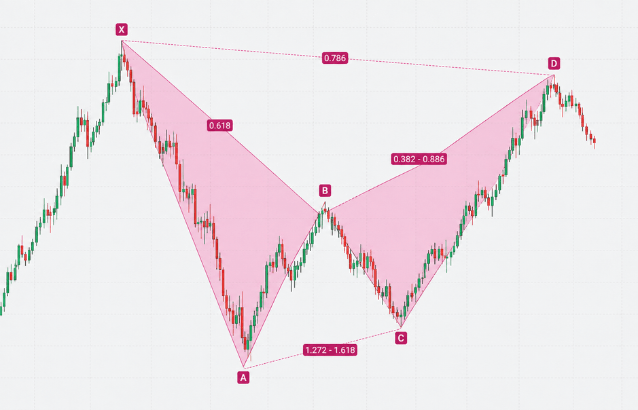
The Gartley pattern is a five-point harmonic formation used to identify where a market correction may be ending. It combines an XABCD price structure with Fibonacci measurements to locate a Potential Reversal Zone, or PRZ, around point D. Although price is expected to reverse at D, the wider setup often represents a continuation of the original XA direction.
What Is the Gartley Pattern?
H.M. Gartley introduced the original formation in his 1935 book, Profits in the Stock Market. It is also called the Gartley 222 because it appeared on page 222. Later harmonic-trading work added the modern 61.8% retracement at B, 78.6% completion at D and AB=CD relationship.
The five swing points are X, A, B, C and D, creating the four legs XA, AB, BC and CD. An M or W shape alone is not enough. The Fibonacci relationships between these legs define the setup.
Gartley Pattern Fibonacci Ratios
Measurement
Typical requirement
XA
Initial impulse and reference leg
AB
Approximately 61.8% retracement of XA
BC
Approximately 38.2% to 88.6% retracement of AB
CD
Commonly a 127.2% to 161.8% extension of BC
D
Approximately 78.6% retracement of XA
AB=CD
AB and CD are equal or form an accepted variation
Point X
D should remain inside X
The defining feature is point B near the 61.8% retracement of XA. At D, the 78.6% XA retracement should converge with the AB=CD calculation and a relevant BC projection.
The levels may not meet at one exact price. Instead, they usually form a narrow PRZ where traders look for a possible reaction. It is not an automatic entry signal or a guaranteed reversal.
Bullish and Bearish Gartley Patterns
A bullish Gartley pattern resembles an M. Price rises from X to A, retraces to B, rebounds towards C and declines into D. Point D should remain above X. If buyers return from the PRZ, the original bullish direction may resume.
A bearish Gartley resembles a W. Price falls from X to A, corrects upwards to B, moves down to C and rallies into D. Point D should remain below X. A bearish reaction may signal that the original downward direction is resuming.
In both versions, the formation is incomplete until price reaches D. Entering during the CD leg means trading a structure whose final ratios can still change.
How to Identify a Gartley Pattern
Begin with a clear XA impulse rather than forcing the pattern around small or irregular swings. Measure AB next. If B is far from the 61.8% XA retracement, the structure may be another harmonic pattern.
After C forms, combine three measurements:
The 78.6% retracement of XA
The AB=CD calculation
The relevant BC extension
Nearby support or resistance may add context. The tighter these levels cluster, the clearer the PRZ becomes.
Traders can measure the structure with Fibonacci and XABCD tools. TradingView, for example, provides a five-point drawing tool covering the XA, AB, BC and CD legs. Scanners may also highlight possible formations, but each result should be checked manually because swing-point and tolerance settings vary.
How to Trade the Gartley Pattern
Wait for Confirmation at D
A touch of the PRZ does not prove that a reversal has begun. Confirmation may include a rejection candle, an engulfing pattern, momentum divergence or a break of the short-term CD trend line.
This separates pattern completion from trade confirmation. A structure can be geometrically complete but still fail to offer a suitable entry.
Plan the Stop-Loss
For a bullish setup, a structural stop-loss may be placed below X. For a bearish setup, it may be placed above X. A volatility buffer may help account for a brief overshoot, but the invalidation rule should be set before entry.
Position size should reflect the distance from entry to stop. Using the same trade size for every setup can create inconsistent risk.
Select Realistic Targets
Point C may act as an initial structural target, while point A may be considered if the reversal continues. Other methods use Fibonacci retracements of the A-to-D move or nearby support and resistance.
There is no compulsory target formula. Compare the possible return with the stop distance before entering, as a technically valid setup may still offer a poor risk-to-reward relationship.
Simple Bullish Gartley Example
Suppose price rises from 100 at X to 120 at A, making XA 20 points long.
A 61.8% retracement places B near:
120 – (20 × 0.618) = 107.64
The 78.6% XA retracement places D near:
120 – (20 × 0.786) = 104.28
Assume C forms near 116.64. The AB and CD legs are then both about 12.36 points, creating an AB=CD relationship. The decline from C to D is also about 137% of BC, within the commonly used extension region.
Several measurements now support the same completion area. Even so, a trader would normally seek bullish confirmation near D rather than buying automatically.
Gartley Pattern vs Bat Pattern
Feature
Gartley
Bat
B retracement of XA
Near 61.8%
Usually 38.2% or 50%
D completion
Near 78.6% of XA
Near 88.6% of XA
Position of D
Inside X
Inside X, but closer to X
The deeper 88.6% XA completion is a defining feature of the standard Bat. Confusing the two patterns changes the expected PRZ and invalidation level.
Common Trading Mistakes
Common errors include treating every M or W as a Gartley, entering before D completes, moving swing points afterwards to make the ratios fit and assuming every PRZ will reverse. Scanner results should also be verified rather than accepted without checking the measurements.
How Reliable Is the Gartley Pattern?
There is no independently verified universal win rate for the Gartley pattern. Claims that harmonic patterns achieve success rates of 80% to 95% deserve caution when the market, timeframe, sample size, entry rules and trading costs are not disclosed.
Results vary with swing-point selection, ratio tolerance, confirmation, volatility, spreads and risk management. A meaningful backtest should use fixed rules and include failed patterns, commissions, spreads and slippage.
Conclusion
The Gartley pattern uses Fibonacci confluence to identify where a correction may end and the original trend may resume. Its defining measurements are the 61.8% retracement at B and the 78.6% XA completion at D, supported by an AB=CD relationship and BC projection.
Treat the PRZ as an area for further analysis, not a guaranteed reversal. Confirmation, a defined invalidation level and realistic targets remain essential.
FAQs
Is the Gartley pattern bullish or bearish?
It can be either. The bullish version resembles an M, while the bearish version resembles a W.
What is the most important Gartley ratio?
Point B should retrace approximately 61.8% of XA.
Where does the pattern complete?
It normally completes near the 78.6% XA retracement at D.
Share Now
Disclaimer:This content is provided for informational purposes only and does not constitute, and should not be construed as, financial, investment, or other professional advice. No statement or opinion contained herein should be considered a recommendation by Ultima Markets or the author regarding any specific investment product, strategy, or transaction. Readers are advised not to rely solely on this material when making investment decisions and should seek independent advice where appropriate.
Thank you for visiting the Ultima Markets website. Please note that this website is intended for individuals residing in jurisdictions where access is permitted by law. Ultima and its affiliated entities do not operate in your home jurisdiction.
By clicking ‘Acknowledge’, you confirm that you are entering this website solely on your own initiative and not as a result of any specific marketing outreach. You wish to obtain information from this website based on reverse solicitation principles, in accordance with the applicable laws of your home jurisdiction.