This website is managed by Ultima Markets’ international entities, and it’s important to emphasise that they are not subject to regulation by the FCA in the UK. Therefore, you must understand that you will not have the FCA’s protection when investing through this website – for example:
You will not be guaranteed Negative Balance Protection
You will not be protected by FCA’s leverage restrictions
You will not have the right to settle disputes via the Financial Ombudsman Service (FOS)
You will not be protected by Financial Services Compensation Scheme (FSCS)
Any monies deposited will not be afforded the protection required under the FCA Client Assets Sourcebook. The level of protection for your funds will be determined by the regulations of the relevant local regulator.
Note: UK clients are kindly invited to visit https://www.ultima-markets.co.uk/. Ultima Markets UK expects to begin onboarding UK clients in accordance with FCA regulatory requirements in 2026.
If you would like to proceed and visit this website, you acknowledge and confirm the following:
1.The website is owned by Ultima Markets’ international entities and not by Ultima Markets UK Ltd, which is regulated by the FCA.
2.Ultima Markets Limited, or any of the Ultima Markets international entities, are neither based in the UK nor licensed by the FCA.
3.You are accessing the website at your own initiative and have not been solicited by Ultima Markets Limited in any way.
4.Investing through this website does not grant you the protections provided by the FCA.
5.Should you choose to invest through this website or with any of the international Ultima Markets entities, you will be subject to the rules and regulations of the relevant international regulatory authorities, not the FCA.
Ultima Markets wants to make it clear that we are duly licensed and authorised to offer the services and financial derivative products listed on our website. Individuals accessing this website and registering a trading account do so entirely of their own volition and without prior solicitation.
By confirming your decision to proceed with entering the website, you hereby affirm that this decision was solely initiated by you, and no solicitation has been made by any Ultima Markets entity.
In this comprehensive analysis, Ultima Markets brings you an insightful breakdown of USDJPY for August 18, 2026.
Technical Analysis of USDJPY
USDJPY Daily Chart Insight
(USDJPY Daily Chart, Source: Ultima Markets MT5)
USDJPY remains under broader corrective pressure on the daily chart after the sharp reversal from the July highs, although the latest candles show a recovery from the recent sell-off.
Price is currently trading around 159.432, close to the declining red 16-period moving average, while remaining below both the purple 50-period moving average and the blue 100-period moving average. The MA16 has turned sharply lower, while the MA50 remains above the MA100, leaving the broader structure mixed but with sellers still holding an advantage below the longer moving averages.
Daily RSI stands at 44.21, recovering from its recent low but remaining below the midpoint area. A sustained recovery above the 160.245 region and the blue MA100 would be needed to strengthen the bullish case, while rejection below this zone would keep the broader correction intact.
Key Levels:
Support 1 (158.550): The nearest visible downside area beneath the current recovery and a level around which recent price action has stabilised.
Support 2 (157.420): A lower recovery zone that acted as an important base following the recent sharp decline.
Support 3 (156.855): A deeper support area near the lower boundary of the latest sell-off structure.
Resistance 1 (159.680): The immediate resistance above the current price and near the upper edge of the latest recovery.
Resistance 2 (160.245): A key resistance area aligned closely with the blue 100-period moving average (MA100).
Resistance 3 (161.375): A higher resistance region near the purple 50-period moving average (MA50), which would need to be reclaimed for a stronger medium-term recovery.
USDJPY 2-Hour Chart Analysis
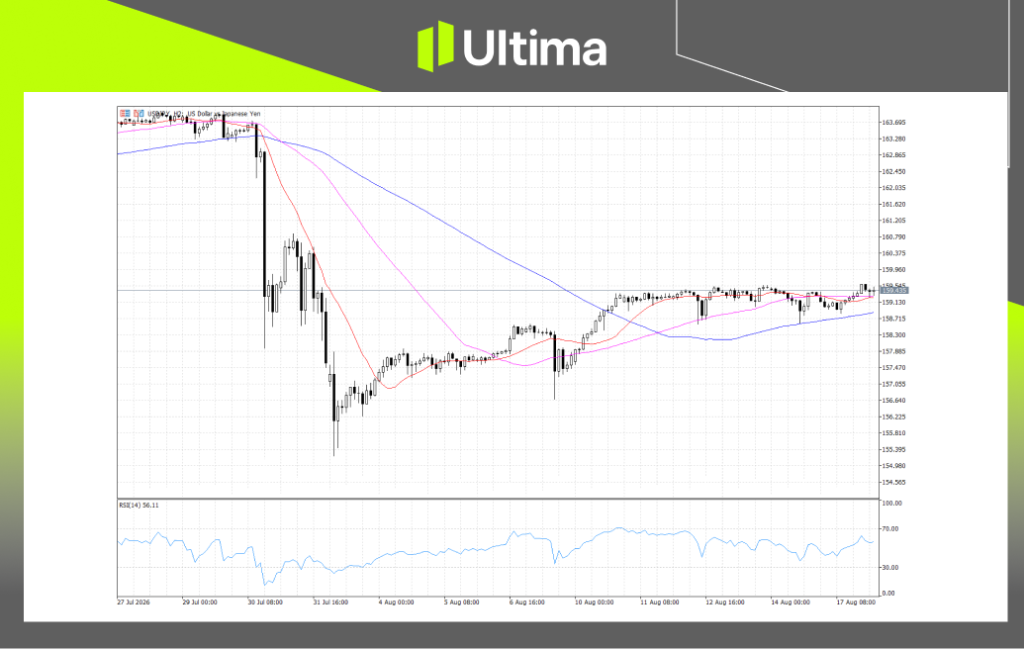
(USDJPY 2-Hour Chart, Source: Ultima Markets MT5)
USDJPY is showing a mildly bullish but consolidating short-term structure on the 2-hour chart. Price at 159.435 is trading above the red 16-period moving average, the purple 50-period moving average, and the rising blue 100-period moving average.
However, the MA16 and MA50 have flattened and converged as price moves sideways around the 159.130–159.680 region, indicating that momentum has slowed after the earlier recovery. RSI at 56.11 remains above the midpoint, supporting a modest buyer advantage without signalling excessive momentum.
The short-term bias therefore remains cautiously bullish, although continued sideways movement is possible unless price can decisively clear the upper consolidation boundary.
Breakout Scenarios:
Bullish continuation is a possible scenario, triggered by a decisive break and hold above 159.680. Such a move would confirm an upside exit from the current consolidation and reopen the higher price region above the recent range.
Bearish correction is a possible scenario, triggered by a failure to hold 159.130 followed by a decisive breakdown. This would expose the 158.715 region and bring the rising blue 100-period moving average (MA100) back into focus as the next support area.
USDJPY Pivot Indicator
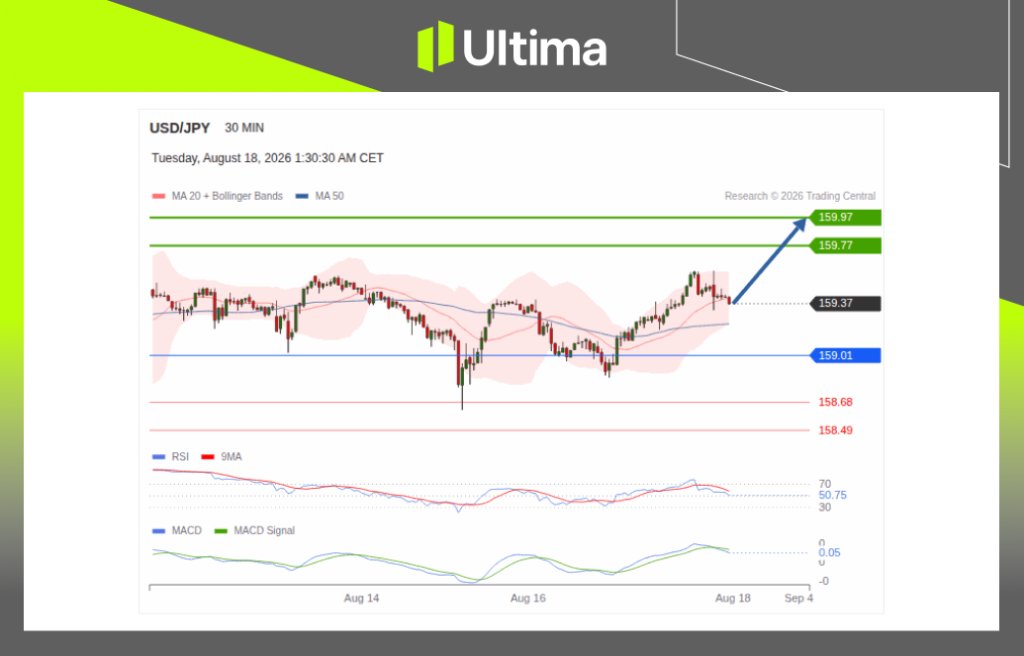
(USDJPY 30-Minute Chart, Source: Trading Central)
USDJPY is trading at 159.37 on the 30-minute chart, holding above the main pivot at 159.01 and maintaining an immediate bullish preference. Price has recovered from the pivot area but is currently pausing below the first upside target.
RSI stands at 50.75, placing momentum close to neutral, while MACD remains positive at 0.05 but has begun to flatten. The combination suggests that the bullish structure remains intact above the pivot, although momentum has eased and a renewed push would be required to confirm continuation.
Bullish Breakout: The bullish preference remains valid while USDJPY holds above the 159.01 pivot. A renewed advance would target 159.77 first, followed by 159.97. Confirmation would be strengthened if RSI remains above 50.75 and MACD holds in positive territory around or above 0.05.
Bearish Rejection: A decisive break below 159.01 would invalidate the immediate bullish preference and expose 158.68 as the first downside target, followed by 158.49. A move in RSI below 50.75 together with MACD falling through the zero line would provide additional bearish confirmation.
Disclaimer Comments, news, research, analysis, price, and all information contained in the article only serve as general information for readers and do not suggest any advice. Ultima Markets has taken reasonable measures to provide up-to-date information, but cannot guarantee accuracy, and may modify without notice. Ultima Markets will not be responsible for any loss incurred due to the application of the information provided.
Thank you for visiting the Ultima Markets website. Please note that this website is intended for individuals residing in jurisdictions where access is permitted by law. Ultima and its affiliated entities do not operate in your home jurisdiction.
By clicking ‘Acknowledge’, you confirm that you are entering this website solely on your own initiative and not as a result of any specific marketing outreach. You wish to obtain information from this website based on reverse solicitation principles, in accordance with the applicable laws of your home jurisdiction.