This website is managed by Ultima Markets’ international entities, and it’s important to emphasise that they are not subject to regulation by the FCA in the UK. Therefore, you must understand that you will not have the FCA’s protection when investing through this website – for example:
You will not be guaranteed Negative Balance Protection
You will not be protected by FCA’s leverage restrictions
You will not have the right to settle disputes via the Financial Ombudsman Service (FOS)
You will not be protected by Financial Services Compensation Scheme (FSCS)
Any monies deposited will not be afforded the protection required under the FCA Client Assets Sourcebook. The level of protection for your funds will be determined by the regulations of the relevant local regulator.
Note: UK clients are kindly invited to visit https://www.ultima-markets.co.uk/. Ultima Markets UK expects to begin onboarding UK clients in accordance with FCA regulatory requirements in 2026.
If you would like to proceed and visit this website, you acknowledge and confirm the following:
1.The website is owned by Ultima Markets’ international entities and not by Ultima Markets UK Ltd, which is regulated by the FCA.
2.Ultima Markets Limited, or any of the Ultima Markets international entities, are neither based in the UK nor licensed by the FCA.
3.You are accessing the website at your own initiative and have not been solicited by Ultima Markets Limited in any way.
4.Investing through this website does not grant you the protections provided by the FCA.
5.Should you choose to invest through this website or with any of the international Ultima Markets entities, you will be subject to the rules and regulations of the relevant international regulatory authorities, not the FCA.
Ultima Markets wants to make it clear that we are duly licensed and authorised to offer the services and financial derivative products listed on our website. Individuals accessing this website and registering a trading account do so entirely of their own volition and without prior solicitation.
By confirming your decision to proceed with entering the website, you hereby affirm that this decision was solely initiated by you, and no solicitation has been made by any Ultima Markets entity.
Ultima Markets does not have an establishment in Singapore and does not operate from Singapore.
Ultima Markets does not provide products or services to citizens or residents of Singapore, and account applications from Singapore citizens or residents will not be accepted.
If you are a citizen or resident of Singapore, please do not open an account or use Ultima Markets’ products or services.
By selecting “Acknowledge and Continue Browsing”, you confirm that you are accessing this website on your own initiative and that your access is not the result of any direct marketing, targeted advertising, solicitation, or promotional activity by Ultima Markets.
Nothing on this website constitutes an offer, solicitation, or promotion of products or services in any jurisdiction where such activity is prohibited. You are responsible for ensuring that your access to and use of this website complies with applicable local laws and regulations.
XAU/USD forecast 2026-2030: gold price predictions, institutional targets, market drivers, technical analysis, and CFD trading tips. Your complete guide.
XAU USD Forecast 2026-2030 & Long Term Outlook
What Is the XAU/USD Forecast for the Next 5 Years?
Over the next five years (2026–2030), gold is expected to continue its long-term uptrend. Here is the year-by-year outlook at a glance:
2026: Gold is forecast to average $4,600–$5,055, supported by central bank buying of ~755 tonnes and continued Federal Reserve rate cuts.
2027: J.P. Morgan targets $5,400/oz as de-dollarization and ETF inflows sustain upward momentum.
2028: Base case estimates range from $6,500 to $8,300, assuming the structural bull trend remains intact.
2029: Analyst models project a range of $7,000 to $9,500, with US fiscal deficit concerns adding a structural premium.
2030: Long-term targets span $7,000 (conservative) to $10,000+ (bull case), with some algorithmic models projecting as high as $15,743.
Year
Low Estimate
Base Case
High Estimate
2026
$4,200
$4,600 – $5,055
$5,500
2027
$4,800
$5,000 – $5,400
$6,000
2028
$5,500
$6,500 – $8,300
$10,000
2029
$6,000
$7,000 – $9,500
$12,000
2030
$7,000
$7,430 – $10,000
$15,000+
Note: All price forecasts are subject to change based on macroeconomic developments. These projections are for informational purposes and do not constitute investment advice.
XAU/USD Forecast 2026
The 2026 environment is broadly supportive for gold. The Federal Reserve is expected to continue its easing cycle, albeit at a measured pace. Central bank demand is projected to absorb approximately 755 tonnes over the course of the year according to J.P. Morgan estimates: a historically high figure that provides a reliable price floor.
Western ETF inflows are forecast to continue adding to holdings, with analysts projecting an additional 250 tonnes of ETF accumulation. Crucially, if the Fed accelerates easing or the dollar weakens materially, these projections could prove conservative.
2026 Base Case Range: $4,400 – $5,055 | Bull Case: $5,500+
XAU/USD Forecast 2027
J.P. Morgan’s extended forecast targets $5,400/oz by end-2027. Metals Focus projects a 2027 average near $5,250.
Bank of America’s bull case extends to $5,300 for 2027. The key variable for 2027 will be whether the Fed pivots into a full easing cycle or maintains a “higher for longer” stance in response to any resurgence of inflation.
A full easing cycle would likely push gold toward and potentially beyond the $5,500 level. A hawkish hold scenario could compress gold back toward $4,500–$4,800.
2027 Base Case Range: $5,000 – $5,400 | Bull Case: $6,000+
XAU/USD Forecast 2028–2029
Forecasts extending out to 2028 and 2029 naturally carry wider uncertainty bands. However, the structural narrative: de-dollarization, fiscal deficit expansion, central bank reserve diversification: remains a compelling long-term foundation.
Conservative models from analysts such as those at RBC and HSBC point to a floor near $5,000–$6,000 by 2028, while more optimistic projections from data models (including LiteFinance’s statistical analysis) suggest a range of $6,360 to as high as $9,685 for 2028.
By 2029, Traders Union’s statistical models project an average near $7,450/oz, while analyst platforms citing dollar weakness and BRICS reserve buying suggest possibilities extending toward $10,000.
2028 Base Case Range: $5,500 – $8,300 | 2029 Base Case: $6,500 – $9,500
XAU/USD Forecast 2030
The 2030 outlook is the most speculative but also the most discussed among macro analysts. Several prominent voices have published long-term targets:
Charlie Morris (Atlantic House Investments): ~$7,000/oz, based on rising inflation expectations and a recalibrated fair value model
Peter Leeds (analyst): $10,000/oz, citing US national debt dynamics and BRICS central bank accumulation Traders Union statistical model: ~$7,430/oz average CoinCodex algorithmic model: Bull case as high as $15,743/oz
The enormous spread in these estimates reflects genuine macro uncertainty a full five years out. What they broadly agree on, however, is that a return to pre-2024 price levels ($2,000–$2,500) is considered extremely unlikely given the structural shift in how central banks and institutional investors now view gold.
2030 Base Case Range: $7,000 – $10,000 | Bull Case: $15,000+
What Is XAU/USD and Why Does It Matter?
XAU/USD is the forex ticker that represents the value of one troy ounce of gold (XAU) measured in US dollars (USD). It is one of the most actively traded instruments in global financial markets: and for good reason.
Gold occupies a unique position in the financial system. Unlike stocks or bonds, it carries no counterparty risk, generates no cash flow, and cannot be printed by any government. These properties have made it a go-to asset for investors seeking to preserve wealth during times of economic uncertainty, currency debasement, or geopolitical turmoil.
For traders, XAU/USD offers some of the highest daily trading volumes and tightest liquidity conditions of any commodity. It responds dynamically to US Federal Reserve policy, the strength or weakness of the US dollar, real interest rate movements, and global risk sentiment: making it one of the most rewarding yet challenging markets to navigate.
Understanding the long-term XAU/USD forecast is therefore essential, whether you are building a strategic investment thesis or planning active trades over the coming years.
XAU/USD in 2025: A Historic Year Recap
Before projecting where gold is heading, it is critical to understand the powerful forces that shaped 2025: one of the most extraordinary years in modern gold market history.
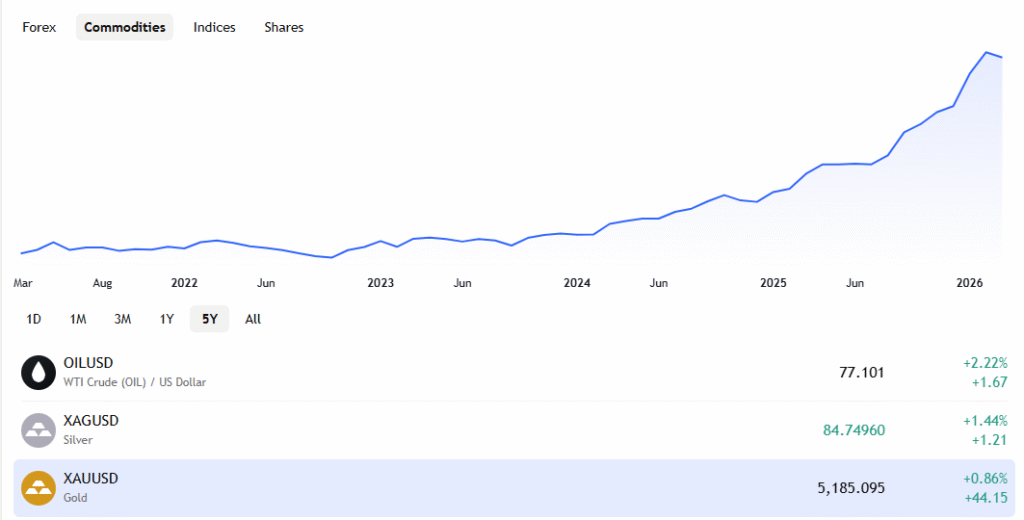
Gold delivered a staggering ~65% annual gain in 2025, breaking all-time records and pushing the XAU/USD rate above $5,000 for the first time ever. The peak reached approximately $5,595.41 on January 29, 2026, just after year-end momentum carried over into the new year.
The key forces that powered this historic rally were:
Central bank accumulation at record pace. Global central banks: led by China, Poland, India, Turkey, and the Czech Republic: purchased gold at a historically elevated rate. Many of these institutions were actively reducing their exposure to US Treasury holdings and diversifying reserves. According to the World Gold Council, central bank demand remained nearly double its ten-year average.
Federal Reserve monetary easing. The Fed cut interest rates multiple times throughout 2025, bringing real yields lower. Because gold pays no interest or dividend, falling real yields reduce the opportunity cost of holding the metal: a classic and powerful tailwind.
Western ETF investor re-engagement. North American gold-backed ETFs alone recorded close to $16 billion in inflows during a single quarter in late 2025, marking the return of the “Western investor” to gold: a group that had been largely absent in prior years.
Persistent geopolitical risk premium. Ongoing conflicts in Ukraine and the Middle East, combined with escalating US trade tariffs and protectionist policy, sustained elevated demand for safe-haven assets throughout the year.
US dollar weakness. As the Fed eased and US fiscal deficit concerns mounted, the dollar softened against major peers. Since gold is priced in dollars, a weaker greenback makes gold more affordable for international buyers: amplifying demand.
All five of these forces remain at least partially in play as of early 2026, providing the structural backdrop for the forecasts discussed below.
Key Fundamental Drivers of the Gold Price (2026–2030)
Federal Reserve Policy and Real Yields
The single most powerful short-to-medium-term driver for XAU/USD is the direction of US real interest rates, nominal rates adjusted for inflation. The mathematical relationship is well established: when real yields fall, gold rises. When real yields rise, gold faces headwinds.
The Fed’s rate path matters because it directly determines real yields. In the current environment, markets are pricing in continued easing through 2026, which would keep real rates suppressed and support gold. The risk to watch is any re-acceleration in inflation that forces the Fed to pause or reverse its easing cycle.
Central Bank Reserve Diversification
This is arguably the most powerful structural driver of gold prices over the 2026–2030 horizon. Central banks, particularly in emerging markets, have been aggressively reducing their exposure to US dollars and Treasuries, and replacing them with gold.
Countries like China, India, Poland, Turkey, Brazil, and South Korea have all actively increased their gold reserves in recent years. Notably, surveys by the World Gold Council indicate that nearly 43% of central banks plan to increase gold holdings over the next 12 months regardless of price. This creates a virtually price-insensitive source of demand that functions as a structural floor.
ETF Inflows and Western Investor Re-Engagement
Gold ETF flows are a real-time indicator of Western institutional and retail sentiment toward gold. When ETF holdings rise, new capital is entering the market; when they fall, capital is exiting. The return of strong ETF inflows in late 2025: after years of net outflows: marked a decisive shift in Western investor positioning.
Sustained ETF inflows going into 2026 and 2027 would confirm that this shift is secular rather than cyclical.
US Dollar Trajectory
Gold and the US dollar have a well-documented inverse relationship. A weaker dollar raises the international purchasing power of gold buyers outside the US, effectively boosting global demand. Key drivers of dollar direction include US fiscal policy (deficit spending pushes the dollar lower), relative interest rate differentials, and the trajectory of US current account deficits.
With US national debt approaching historically unprecedented levels relative to GDP, a longer-term structural case for dollar weakness: and therefore gold strength: is gaining traction among macro analysts.
Geopolitical Risk Premium
Gold benefits from a persistent “risk premium” when geopolitical uncertainty is elevated. Conflicts, trade wars, sanctions regimes, and political instability all drive capital into assets with no counterparty risk. Until global geopolitical conditions stabilize meaningfully, this premium is unlikely to disappear. Emerging multipolarity in the global financial system: including the growing influence of BRICS nations: adds a structural, not merely cyclical, dimension to this dynamic.
Inflation as a Structural Tailwind
Gold has served as a reliable long-term inflation hedge over centuries. While its short-term correlation with inflation is imperfect, persistent above-target inflation erodes the real value of cash and bonds: making gold increasingly attractive on a relative basis. If inflation remains structurally higher than central bank targets throughout the late 2020s, this would be a powerful multi-year tailwind.
XAU/USD Outlook from 2026 to 2030
The XAU/USD outlook over the next five years is underpinned by one of the most powerful structural shifts the gold market has ever seen. This is not simply a cyclical bull market driven by a temporary alignment of factors: it reflects a fundamental reappraisal of gold’s role in global finance.
Central banks around the world have structurally increased their gold allocations. Western investors have returned to gold via ETFs. Real yields remain under pressure from Fed easing. Geopolitical fragmentation continues to drive safe-haven demand. And the long-term trajectory of US fiscal policy raises legitimate questions about the durability of dollar-denominated reserve assets.
For traders and investors, this environment presents both significant opportunity and meaningful risk. The upside case for XAU/USD from 2026 to 2030 (with base case targets of $5,000–$10,000) is supported by a broader consensus among major financial institutions than at any previous time in history.
At the same time, risks are real. A surprise Fed hawkish pivot, a strong equity-driven risk-on rally, or a significant de-escalation in geopolitical tensions could create sharp pullbacks. Disciplined risk management: defined stop-losses, appropriate position sizing, and trading only what you can afford to lose: is essential.
The traders who succeed over this period will be those who understand the macro forces at play, maintain a systematic approach to entries and exits, and treat risk management as the foundation of every trade.
Ready to trade XAU/USD? Open a live or demo account with us today. Access professional charting tools, tight spreads on gold, and expert daily market analysis: everything you need to trade the world’s most dynamic commodity pair.
FAQs
What is the XAU/USD forecast for 2026?
The consensus among major institutions places gold in the $4,200–$5,055 range for 2026, with J.P. Morgan and Bank of America targeting $5,000+ by Q4 2026. The key driver is continued central bank buying and potential Federal Reserve rate cuts.
What is the gold price prediction for 2030?
Long-term predictions for 2030 range from approximately $7,000 on the conservative end to $10,000 (Peter Leeds) and as high as $15,743 in the most bullish algorithmic models. The most cited base case sits around $7,000–$10,000/oz by 2030.
Will gold reach $6,000 by 2026?
The $6,000 level represents the bull case scenario for 2026 and is not the central forecast from most major institutions. However, if the Fed accelerates easing and ETF inflows continue at the pace seen in late 2025, a push toward $6,000 is plausible within 12–18 months.
Share Now
Disclaimer:This content is provided for informational purposes only and does not constitute, and should not be construed as, financial, investment, or other professional advice. No statement or opinion contained herein should be considered a recommendation by Ultima Markets or the author regarding any specific investment product, strategy, or transaction. Readers are advised not to rely solely on this material when making investment decisions and should seek independent advice where appropriate.
Thank you for visiting the Ultima Markets website. Please note that this website is intended for individuals residing in jurisdictions where access is permitted by law. Ultima and its affiliated entities do not operate in your home jurisdiction.
By clicking ‘Acknowledge’, you confirm that you are entering this website solely on your own initiative and not as a result of any specific marketing outreach. You wish to obtain information from this website based on reverse solicitation principles, in accordance with the applicable laws of your home jurisdiction.