Important Information
This website is managed by Ultima Markets’ international entities, and it’s important to emphasise that they are not subject to regulation by the FCA in the UK. Therefore, you must understand that you will not have the FCA’s protection when investing through this website – for example:
- You will not be guaranteed Negative Balance Protection
- You will not be protected by FCA’s leverage restrictions
- You will not have the right to settle disputes via the Financial Ombudsman Service (FOS)
- You will not be protected by Financial Services Compensation Scheme (FSCS)
- Any monies deposited will not be afforded the protection required under the FCA Client Assets Sourcebook. The level of protection for your funds will be determined by the regulations of the relevant local regulator.
Note: Ultima Markets is currently developing a dedicated website for UK clients and expects to onboard UK clients under FCA regulations in 2026.
If you would like to proceed and visit this website, you acknowledge and confirm the following:
- 1.The website is owned by Ultima Markets’ international entities and not by Ultima Markets UK Ltd, which is regulated by the FCA.
- 2.Ultima Markets Limited, or any of the Ultima Markets international entities, are neither based in the UK nor licensed by the FCA.
- 3.You are accessing the website at your own initiative and have not been solicited by Ultima Markets Limited in any way.
- 4.Investing through this website does not grant you the protections provided by the FCA.
- 5.Should you choose to invest through this website or with any of the international Ultima Markets entities, you will be subject to the rules and regulations of the relevant international regulatory authorities, not the FCA.
Ultima Markets wants to make it clear that we are duly licensed and authorised to offer the services and financial derivative products listed on our website. Individuals accessing this website and registering a trading account do so entirely of their own volition and without prior solicitation.
By confirming your decision to proceed with entering the website, you hereby affirm that this decision was solely initiated by you, and no solicitation has been made by any Ultima Markets entity.
I confirm my intention to proceed and enter this website Please direct me to the website operated by Ultima Markets , regulated by the FCA in the United KingdomWhat is the Falling Wedge Pattern?
Uncertainty is a constant in financial markets. But within that chaos, certain price patterns tend to repeat themselves. One of the most reliable among them is the falling wedge pattern, a bullish formation that often signals that a downtrend is losing strength and a reversal may be near.
Whether in stocks, forex, or crypto markets, the falling wedge pattern helps traders identify moments when selling pressure is fading and buyers are quietly stepping back in. Understanding how it forms, why it works, and how to trade it can help turn uncertainty into opportunity.
What Is the Falling Wedge Pattern?

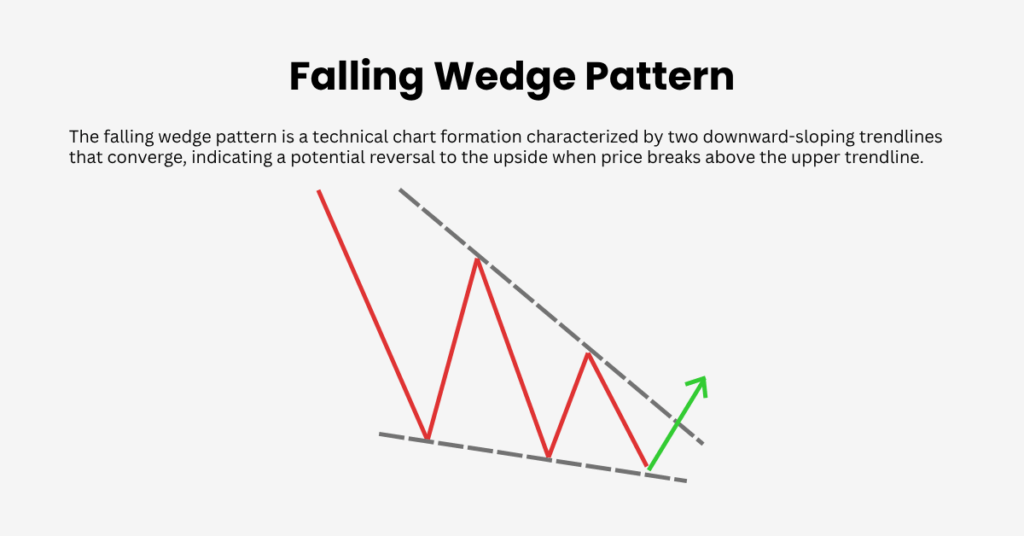
The falling wedge pattern is a technical chart formation where two downward-sloping trendlines converge, meaning the upper trendline falls faster than the lower one. As price moves between these narrowing boundaries, it makes lower highs and lower lows, showing that bears are still in control, but losing momentum.
The breakout signal occurs when price closes above the upper trendline, often accompanied by a rise in trading volume. This marks a potential shift from bearish to bullish sentiment, suggesting that buyers are gradually regaining control.
Why the Falling Wedge Matters
Unlike many chart formations, the falling wedge can act in two different contexts:
- As a reversal pattern, it forms after a prolonged downtrend, signaling a potential bullish reversal.
- As a continuation pattern, it develops during an existing uptrend as a temporary correction before the uptrend resumes.
In both cases, the falling wedge reflects market compression, a period where volatility narrows before a decisive move occurs, usually to the upside.
How to Identify a Falling Wedge
To confirm a valid falling wedge, traders look for:
- Two converging descending trendlines connecting lower highs and lower lows.
- Decreasing volume as the pattern develops, showing sellers’ momentum is fading.
- Tightening price range, meaning each swing becomes smaller than the previous one.
- A breakout with strong volume, providing confirmation that bullish pressure has returned.
The pattern is most reliable on higher timeframes such as the 4-hour, daily, or weekly charts, where noise is reduced and breakouts carry more weight.
How Reliable Is the Falling Wedge Pattern?
The falling wedge is one of the most reliable bullish patterns in technical analysis, but like all patterns, it comes with its nuances. The key to making the most of it lies in understanding its context and waiting for proper confirmation.

Recent studies and trading platform data shed light on how often the falling wedge lives up to its potential:
- TradingView analysis shows that about 82% of falling wedges break to the upside, with 63–88% reaching their projected price targets. That’s a strong success rate, but it’s not foolproof.
- Research from PersonalFinanceLab suggests that the wedge hits its measured-move target in two-thirds of cases, which positions it as a solid contender among bullish reversal setups.
- Thomas Bulkowski, one of the most well-known experts in pattern recognition, finds that falling wedges tend to perform best after a clear downtrend and when breakout volume is significantly above average.
However, there’s a flip side:
- The false breakout rate for falling wedges ranges between 10% and 27%, meaning you’ll want to wait for confirmation before jumping in.
So, what makes the falling wedge reliable? Here are the key factors:
- A strong downtrend before the wedge forms signals that sellers are getting exhausted.
- Volume contraction within the wedge followed by a surge in volume on breakout adds confidence to the move.
- Momentum indicators like RSI or MACD should show signs of bullish divergence
- Larger, well-formed wedges (those that span several weeks) are typically more reliable than smaller, quicker ones.
In short, the falling wedge is not foolproof, but when you have the right conditions of strong volume, the proper context, and momentum backing the move, it can be one of the most dependable bullish reversal signals out there.
How to Trade the Falling Wedge Pattern
Once a breakout occurs above the upper trendline, traders typically look to:
- Enter a buy position just above the breakout level.
- Set a stop-loss slightly below the most recent swing low or the lower wedge boundary.
- Project a target by measuring the widest part of the wedge and adding it to the breakout point.
Many traders also wait for a retest, which is when the price briefly returns to the breakout line before bouncing higher. This often confirms the breakout’s validity and improves risk-to-reward ratio.
Common Mistakes and False Breakouts
Despite its strong record, traders should be cautious of:
- Entering too early before a confirmed breakout.
- Ignoring volume because breakouts on weak volume often fail.
- Misidentifying the pattern. Descending channels or triangles can look similar but carry different implications.
- Trading against major trends. In strong downtrends, even valid falling wedges can take longer to play out.
Approximately 10–27% of falling wedges lead to false breakouts, according to studies, underscoring why confirmation and risk control are essential.
Final Thoughts

The falling wedge pattern is a timeless signal of exhaustion in bearish momentum and a potential turning point in price action. When identified correctly, it can offer high-probability entry opportunities with favourable risk-reward ratios.
But as with all technical tools, its power lies in discipline and context, not prediction. Combining wedge analysis with volume, support/resistance, and sound money management helps traders use it wisely, whether on stocks, forex, or digital assets.
Disclaimer: This content is provided for informational purposes only and does not constitute, and should not be construed as, financial, investment, or other professional advice. No statement or opinion contained here in should be considered a recommendation by Ultima Markets or the author regarding any specific investment product, strategy, or transaction. Readers are advised not to rely solely on this material when making investment decisions and should seek independent advice where appropriate.


