This website is managed by Ultima Markets’ international entities, and it’s important to emphasise that they are not subject to regulation by the FCA in the UK. Therefore, you must understand that you will not have the FCA’s protection when investing through this website – for example:
You will not be guaranteed Negative Balance Protection
You will not be protected by FCA’s leverage restrictions
You will not have the right to settle disputes via the Financial Ombudsman Service (FOS)
You will not be protected by Financial Services Compensation Scheme (FSCS)
Any monies deposited will not be afforded the protection required under the FCA Client Assets Sourcebook. The level of protection for your funds will be determined by the regulations of the relevant local regulator.
Note: UK clients are kindly invited to visit https://www.ultima-markets.co.uk/. Ultima Markets UK expects to begin onboarding UK clients in accordance with FCA regulatory requirements in 2026.
If you would like to proceed and visit this website, you acknowledge and confirm the following:
1.The website is owned by Ultima Markets’ international entities and not by Ultima Markets UK Ltd, which is regulated by the FCA.
2.Ultima Markets Limited, or any of the Ultima Markets international entities, are neither based in the UK nor licensed by the FCA.
3.You are accessing the website at your own initiative and have not been solicited by Ultima Markets Limited in any way.
4.Investing through this website does not grant you the protections provided by the FCA.
5.Should you choose to invest through this website or with any of the international Ultima Markets entities, you will be subject to the rules and regulations of the relevant international regulatory authorities, not the FCA.
Ultima Markets wants to make it clear that we are duly licensed and authorised to offer the services and financial derivative products listed on our website. Individuals accessing this website and registering a trading account do so entirely of their own volition and without prior solicitation.
By confirming your decision to proceed with entering the website, you hereby affirm that this decision was solely initiated by you, and no solicitation has been made by any Ultima Markets entity.
This Website is intended solely for individuals located in jurisdictions where access to its content is permitted under applicable laws and regulations.
Ultima Market is not established in, and does not operate from, Singapore. Ultima Market does not offer, provide or solicit its products or services to citizens or residents of Singapore and does not accept account applications from such persons.
If you are a citizen or resident of Singapore, you must not apply to open an account or attempt to access or use any products or services offered by Ultima Market.
By clicking “Acknowledge and Enter the Website”, you confirm that you are accessing this Website entirely on your own initiative and not as a result of any direct solicitation, targeted marketing, advertising or promotional activity by Ultima Market.
Access to this Website does not constitute an offer, invitation or solicitation by Ultima Market to provide any product or service in any jurisdiction where such offer, invitation or solicitation would be unlawful.
You are responsible for ensuring that your access to this Website is permitted under the laws and regulations applicable to you .
Learn what a continuation pattern is. Explore flags, pennants, triangles and rectangles, and discover how traders confirm breakouts and manage its risks.
A continuation pattern is a chart formation that appears when an existing market trend pauses before potentially continuing in the same direction. These patterns help traders identify periods of consolidation, possible breakout levels and areas where a trend may regain momentum.
Markets rarely move in a straight line. After a strong rally or decline, traders often take profits while others wait for new opportunities. This creates a temporary balance between buyers and sellers, causing price to move sideways or form a recognisable structure before the next major move.
In this article, Ultima Markets will take you through what a continuation pattern is, the most common types, how traders confirm breakouts and the risks to consider before using these formations in their trading decisions.
What is a Continuation Pattern?
A continuation pattern is a technical analysis formation that suggests the current trend may continue after a period of consolidation. It usually develops in three stages:
Existing trend: The market moves strongly in one direction.
Consolidation phase: Price pauses as buying and selling pressure becomes more balanced.
Breakout: Price moves beyond the pattern’s support or resistance level, potentially restarting the previous trend.
For example, after a strong upward move, buyers may temporarily lose momentum as some traders lock in profits. However, if sellers cannot push the price significantly lower, the market may form a bullish continuation pattern before moving higher again.
Continuation patterns are different from reversal patterns. While continuation formations suggest the existing trend may resume, reversal patterns indicate a possible change in market direction.
However, traders should remember that these patterns do not guarantee future price movements. A breakout can fail, and price may reverse instead of continuing the original trend.
Why Do Continuation Patterns Form?
Continuation patterns form because markets go through periods of expansion and consolidation.
During a strong trend, early buyers or sellers may begin closing positions, reducing momentum. At the same time, new traders may wait for confirmation before entering. This creates a temporary trading range where price moves between support and resistance.
This consolidation period allows the market to absorb previous price movements. When buying or selling pressure becomes dominant again, price may break out of the pattern and continue in the direction of the broader trend.
The quality of a continuation pattern often depends on several factors:
A clear trend before the formation
Well-defined support and resistance levels
Multiple price reactions around the pattern boundaries
Confirmation after the breakout
Common Types of Continuation Patterns
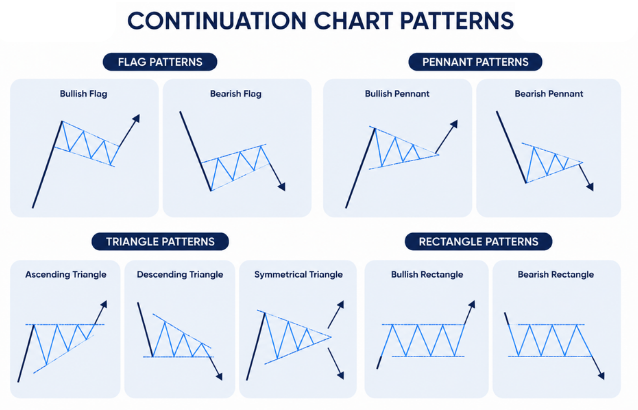
Several chart formations are commonly associated with trend continuation. The most recognised continuation patterns include flags, pennants, triangles and rectangles.
Pattern
Structure
Common interpretation
Flag
Short consolidation channel after a strong move
Possible continuation after a brief pullback
Pennant
Small symmetrical triangle after a sharp move
Price compression before a potential breakout
Triangle
Converging support and resistance lines
Market uncertainty before expansion
Rectangle
Horizontal trading range
Continuation after a breakout from support or resistance
Flag pattern
A flag pattern develops after a strong price movement, often called the flagpole. Following this move, price enters a short consolidation period that usually forms a small channel.
A bullish flag appears after an upward move and often slopes slightly lower as traders take profits. A bearish flag forms after a decline and may move slightly higher before sellers regain control.
Traders typically watch for a breakout beyond the flag boundary. A move above resistance may suggest bullish continuation, while a break below support may indicate further downside.
Pennant pattern
A pennant is similar to a flag but has converging trendlines that create a small triangle shape. It usually appears after a strong price movement when volatility decreases temporarily.
A bullish pennant forms after an upward move, while a bearish pennant develops after a downward move. The breakout direction is often monitored closely because it may signal the next stage of the trend.
However, traders should not assume every pennant will continue the previous movement. Confirmation through price action and market context remains important.
Triangle patterns
Triangle patterns form when price gradually moves into a narrower range. The three main types are:
Symmetrical triangle
This pattern forms when lower highs and higher lows create converging trendlines. It can break in either direction, although the previous trend may provide some context.
Ascending triangle
This pattern features a horizontal resistance level and rising support. It is often viewed as having a bullish bias because buyers are becoming increasingly aggressive.
Descending triangle
This pattern features horizontal support and declining resistance. It is often associated with bearish pressure.
Despite these common interpretations, triangles can produce false breakouts. Traders should wait for confirmation rather than relying only on the pattern’s appearance.
Rectangle pattern
A rectangle forms when price moves between a clear support and resistance range. It shows a period where buyers and sellers are relatively balanced.
If price breaks above resistance, traders may interpret it as a bullish continuation signal. If price falls below support, it may suggest bearish continuation.
Until a breakout occurs, a rectangle remains a consolidation zone rather than a confirmed continuation pattern.
How to Trade a Continuation Pattern
Trading a continuation pattern involves more than simply identifying a chart shape. Traders usually consider several steps before entering a position.
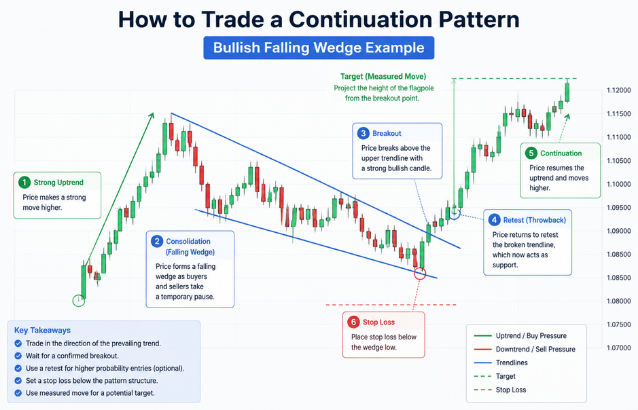
1. Identify the existing trend
A continuation setup is more meaningful when there is already a clear market direction. Traders often look for higher highs and higher lows during an uptrend, or lower highs and lower lows during a downtrend.
A pattern forming in a sideways market may not provide the same level of confirmation.
2. Wait for breakout confirmation
A breakout occurs when price moves beyond the pattern boundary. Some traders enter immediately after the breakout, while others wait for a retest.
A retest happens when price returns to the previous resistance or support level after breaking out. If the level holds, it may provide additional confirmation that the breakout is valid.
A failed breakout occurs when price moves outside the pattern but quickly returns inside. This is why confirmation is an important part of trading continuation patterns.
3. Set risk management levels
Before entering a trade, traders should identify where their idea becomes invalid.
For a bullish continuation pattern, this may be below the recent swing low or below the pattern structure. For a bearish setup, it may be above the latest swing high or resistance area.
Risk management is essential because even well-formed continuation patterns can fail.
4. Consider price targets
Some traders use measured-move techniques to estimate possible targets.
For example:
Flags and pennants often use the length of the previous move as a reference
Triangles and rectangles may use the height of the pattern range
These targets are only potential areas of interest and should not be treated as guaranteed outcomes.
Limitations of Continuation Patterns
Although continuation patterns can help traders organise their analysis, they have several limitations.
False breakouts are one of the biggest challenges. Price may briefly move beyond support or resistance before reversing back into the previous range.
Another limitation is subjectivity. Different traders may draw trendlines differently, meaning the same chart can sometimes produce different interpretations.
Volume can also provide additional confirmation, but traders should consider the market they are trading. In stock and futures markets, exchange volume can be useful. In spot Forex, there is no single centralised volume source, so traders often rely on broker-provided tick volume as supporting information rather than a complete market measurement.
Conclusion
A continuation pattern provides traders with a framework for identifying potential trend continuation after a period of consolidation. Flags, pennants, triangles and rectangles are among the most widely recognised formations used in technical analysis.
However, these patterns should not be viewed as guaranteed signals. A stronger approach combines pattern recognition with breakout confirmation, risk management and broader market analysis.
By understanding how continuation patterns form and how to manage their risks, traders can make more structured decisions instead of relying solely on price movements.
FAQs
What is a continuation pattern in trading?
A continuation pattern is a chart formation that suggests an existing trend may continue after a temporary pause.
What are the main continuation patterns?
The most common continuation patterns are flags, pennants, triangles and rectangles.
Are continuation patterns always accurate?
No. They can produce false breakouts and should be combined with confirmation and risk management.
How do traders confirm a continuation pattern?
Traders usually wait for price to break beyond support or resistance and may look for a retest before entering.
Share Now
Disclaimer:This content is provided for informational purposes only and does not constitute, and should not be construed as, financial, investment, or other professional advice. No statement or opinion contained herein should be considered a recommendation by Ultima Markets or the author regarding any specific investment product, strategy, or transaction. Readers are advised not to rely solely on this material when making investment decisions and should seek independent advice where appropriate.
Thank you for visiting the Ultima Markets website. Please note that this website is intended for individuals residing in jurisdictions where access is permitted by law. Ultima and its affiliated entities do not operate in your home jurisdiction.
By clicking ‘Acknowledge’, you confirm that you are entering this website solely on your own initiative and not as a result of any specific marketing outreach. You wish to obtain information from this website based on reverse solicitation principles, in accordance with the applicable laws of your home jurisdiction.