This website is managed by Ultima Markets’ international entities, and it’s important to emphasise that they are not subject to regulation by the FCA in the UK. Therefore, you must understand that you will not have the FCA’s protection when investing through this website – for example:
You will not be guaranteed Negative Balance Protection
You will not be protected by FCA’s leverage restrictions
You will not have the right to settle disputes via the Financial Ombudsman Service (FOS)
You will not be protected by Financial Services Compensation Scheme (FSCS)
Any monies deposited will not be afforded the protection required under the FCA Client Assets Sourcebook. The level of protection for your funds will be determined by the regulations of the relevant local regulator.
Note: UK clients are kindly invited to visit https://www.ultima-markets.co.uk/. Ultima Markets UK expects to begin onboarding UK clients in accordance with FCA regulatory requirements in 2026.
If you would like to proceed and visit this website, you acknowledge and confirm the following:
1.The website is owned by Ultima Markets’ international entities and not by Ultima Markets UK Ltd, which is regulated by the FCA.
2.Ultima Markets Limited, or any of the Ultima Markets international entities, are neither based in the UK nor licensed by the FCA.
3.You are accessing the website at your own initiative and have not been solicited by Ultima Markets Limited in any way.
4.Investing through this website does not grant you the protections provided by the FCA.
5.Should you choose to invest through this website or with any of the international Ultima Markets entities, you will be subject to the rules and regulations of the relevant international regulatory authorities, not the FCA.
Ultima Markets wants to make it clear that we are duly licensed and authorised to offer the services and financial derivative products listed on our website. Individuals accessing this website and registering a trading account do so entirely of their own volition and without prior solicitation.
By confirming your decision to proceed with entering the website, you hereby affirm that this decision was solely initiated by you, and no solicitation has been made by any Ultima Markets entity.
What is relative volume in stocks? Learn how RVOL works, how to read it, and why traders use it to spot unusual trading activity before a move on charts.
What Is Relative Volume in Stocks?
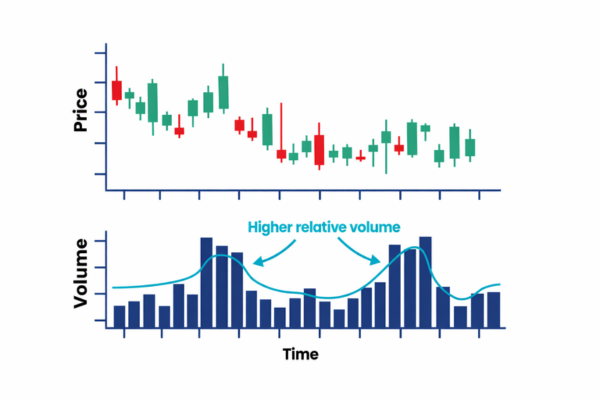
When people search for what is relative volume in stocks, they usually want to know whether a stock is trading normally or whether something unusual is happening. Regular volume tells you how many shares changed hands. Relative volume, or RVOL, tells you whether that trading activity is high or low compared with the stock’s recent average.
That added context is what makes it useful. A stock trading 5 million shares may seem active, but that number means very different things depending on whether it usually trades 2 million shares a day or 20 million. Relative volume helps you compare current activity with what is typical for that specific stock.
Definition of the Relative Volume
Relative volume compares current volume with average volume over a chosen period. A reading of 1.0 means the stock is trading at about its usual pace. A reading above 1.0 means activity is above average, while a reading below 1.0 means activity is below average.
One important detail is that there is no single standard setting across every platform. The idea stays the same, but the lookback period can vary. Some tools may use 10 periods, while others may use 30 or 50. That means RVOL numbers can differ slightly depending on the charting platform or scanner you use.
The Relative Volume Formula
The formula is simple:
Relative Volume = Current Volume ÷ Average Volume
For example, if a stock usually trades 2 million shares a day and has traded 4 million shares today, its relative volume is 2.0. If it has traded only 1 million shares, its relative volume is 0.5.
This quick ratio tells you whether participation is stronger or weaker than normal.
Why Relative Volume Matters
Relative volume matters because price moves usually mean more when more traders are involved. A breakout on strong relative volume often carries more weight than the same breakout on light activity. The same idea applies to breakdowns, reversals, and sudden price spikes.
It also helps traders judge liquidity. Stocks with stronger trading activity are generally easier to enter and exit than thinly traded names. That is why RVOL is often used as a filter when scanning for active stocks.
What Counts as High Relative Volume?
The baseline is 1.0, but not every reading above 1 is meaningful. In practice, many traders pay closer attention once RVOL moves above 2.0, because that can suggest the stock is trading at twice its normal pace.
A stock at 1.2 may simply be a little busier than usual. A stock at 2.0 is showing clearly elevated activity. A stock at 4.0 or higher often has a major catalyst behind it, such as earnings, breaking news, or a sharp market reaction.
Still, high relative volume is not automatically bullish. A panic selloff or news-driven drop can create the same kind of spike. RVOL shows unusual participation, not direction.
What Causes Relative Volume to Spike?
Most RVOL spikes happen because something has changed. Common catalysts include earnings reports, analyst upgrades or downgrades, company announcements, economic news, index rebalancing, or a sudden wave of attention from retail traders.
This is why relative volume works well in stock scanners. It does not explain the full story, but it quickly points you toward stocks where something important may be happening.
Once a stock shows unusually high RVOL, the next step is to check the chart and look for the reason behind the move.
Relative Volume vs. Average Daily Trading Volume
It also helps to separate relative volume from average daily trading volume. Average daily trading volume is simply the average number of shares traded over a set period. Relative volume uses that baseline to show whether the current session is quiet, normal, or unusually active.
In short, average volume is the benchmark. Relative volume is the comparison.
Why Relative Volume at Time Is Useful
Intraday traders often use a more precise version called relative volume at time. Instead of comparing today’s volume with a full-day average, it compares volume at a specific point in the session with the stock’s typical volume at that same time.
That matters because volume follows a daily pattern. The open is usually busy, midday tends to slow down, and activity can rise again later in the session. So a stock may not look unusual against a full-day average, but it may still be trading far more actively than normal for 10:30 a.m.
This makes time-based RVOL especially helpful for short-term traders who want a clearer view of unusual activity during the day.
What Relative Volume Cannot Tell You
As useful as it is, RVOL has limits. It tells you that trading activity is unusual, but it does not tell you whether buyers or sellers are in control. It also cannot tell you whether a few large trades are distorting the reading.
That is especially important in low-priced or thinly traded stocks, where volume spikes can appear alongside sharp volatility or unreliable price moves. A high RVOL reading should be treated as a sign to investigate further, not as proof that a stock is a good trade.
Conclusion
So, what is relative volume in stocks? It is a ratio that compares current trading volume with average trading volume. That sounds simple, but it can be a very useful way to understand whether a stock is attracting normal attention or unusually strong interest.
The real value of relative volume is context. It helps you separate routine price action from moments when participation clearly stands out. Used together with price action, trend, liquidity, and catalysts, it can give you a much better read on what is happening in a stock than raw volume alone.
FAQs
Is relative volume good for stocks?
Relative volume is useful because it shows whether a stock is trading more or less actively than usual. Higher relative volume can signal stronger interest, but it should still be used with price action and market context.
What is a good relative volume for a stock?
A relative volume of 1.0 means a stock is trading at its normal pace. Many traders pay closer attention when relative volume rises above 2.0, as that can suggest unusually strong activity.
What does a relative volume of 2 mean?
A relative volume of 2 means the stock is trading at twice its average volume over the chosen period. This often suggests stronger participation than normal.
Share Now
Disclaimer:This content is provided for informational purposes only and does not constitute, and should not be construed as, financial, investment, or other professional advice. No statement or opinion contained herein should be considered a recommendation by Ultima Markets or the author regarding any specific investment product, strategy, or transaction. Readers are advised not to rely solely on this material when making investment decisions and should seek independent advice where appropriate.
Thank you for visiting the Ultima Markets website. Please note that this website is intended for individuals residing in jurisdictions where access is permitted by law. Ultima and its affiliated entities do not operate in your home jurisdiction.
By clicking ‘Acknowledge’, you confirm that you are entering this website solely on your own initiative and not as a result of any specific marketing outreach. You wish to obtain information from this website based on reverse solicitation principles, in accordance with the applicable laws of your home jurisdiction.