This website is managed by Ultima Markets’ international entities, and it’s important to emphasise that they are not subject to regulation by the FCA in the UK. Therefore, you must understand that you will not have the FCA’s protection when investing through this website – for example:
You will not be guaranteed Negative Balance Protection
You will not be protected by FCA’s leverage restrictions
You will not have the right to settle disputes via the Financial Ombudsman Service (FOS)
You will not be protected by Financial Services Compensation Scheme (FSCS)
Any monies deposited will not be afforded the protection required under the FCA Client Assets Sourcebook. The level of protection for your funds will be determined by the regulations of the relevant local regulator.
Note: UK clients are kindly invited to visit https://www.ultima-markets.co.uk/. Ultima Markets UK expects to begin onboarding UK clients in accordance with FCA regulatory requirements in 2026.
If you would like to proceed and visit this website, you acknowledge and confirm the following:
1.The website is owned by Ultima Markets’ international entities and not by Ultima Markets UK Ltd, which is regulated by the FCA.
2.Ultima Markets Limited, or any of the Ultima Markets international entities, are neither based in the UK nor licensed by the FCA.
3.You are accessing the website at your own initiative and have not been solicited by Ultima Markets Limited in any way.
4.Investing through this website does not grant you the protections provided by the FCA.
5.Should you choose to invest through this website or with any of the international Ultima Markets entities, you will be subject to the rules and regulations of the relevant international regulatory authorities, not the FCA.
Ultima Markets wants to make it clear that we are duly licensed and authorised to offer the services and financial derivative products listed on our website. Individuals accessing this website and registering a trading account do so entirely of their own volition and without prior solicitation.
By confirming your decision to proceed with entering the website, you hereby affirm that this decision was solely initiated by you, and no solicitation has been made by any Ultima Markets entity.
Learn about the descending triangle pattern and see how it indicates a bearish bias. Compare it with the other triangle patterns for technical analysis.
The Descending Triangle Pattern Explained
The descending triangle is one of the most widely recognised chart patterns in technical analysis. It serves as a valuable tool for predicting potential price movements, especially in bearish trends.
Traders use this pattern to analyse the ongoing battle between buyers and sellers and to anticipate when selling pressure may persist.
By understanding how to identify, interpret, and trade the descending triangle, you can enhance your market strategies and decision-making.
What is the Descending Triangle Pattern?
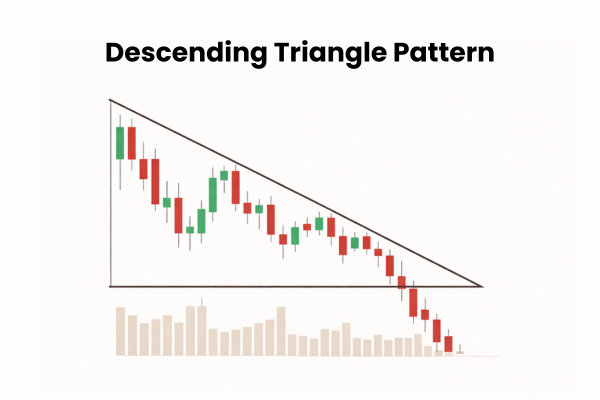
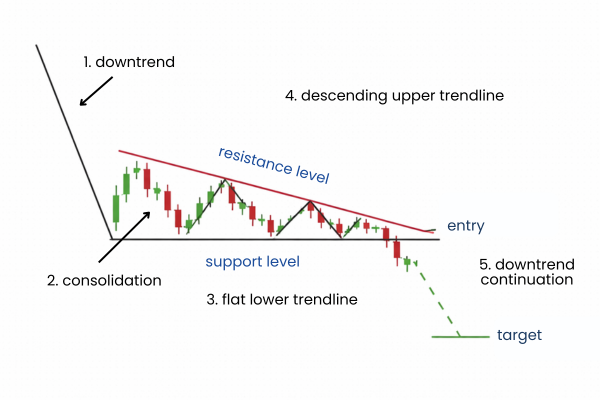
The descending triangle is a bearish continuation pattern that typically forms during a downtrend. It consists of two key trendlines:
A horizontal support line: A consistent level where buyers try to hold the price steady, acting as a floor for the asset.
A descending resistance line: A downward-sloping line formed by progressively lower highs, indicating that sellers are gaining more control.
This pattern represents a period of consolidation, where the price moves between the support and resistance lines, gradually narrowing as the price approaches the apex of the triangle. This compression in price movement is one of the key features of the descending triangle, signaling that a breakout is likely to occur.
How to Spot the Descending Triangle
To identify a descending triangle, look for the following features:
Lower Highs: The resistance line is formed by at least two swing highs, each lower than the last, showing that sellers are willing to accept lower prices.
Flat Support: The support line connects at least two swing lows at roughly the same price level, where buyers are stepping in to prevent further declines.
Volume Contraction: As the pattern develops, volume tends to decrease, reflecting reduced market participation. A breakout with increased volume is a strong confirmation of the pattern.
The tug-of-war analogy is often used to describe the descending triangle. Imagine two teams pulling on opposite ends of a rope. One team gradually weakens, while the other begins to dominate.
In the case of the descending triangle, buyers start losing strength, and sellers take control, pushing the price lower. As the price action narrows, the pressure builds for a breakout.
How to Trade the Descending Triangle
When trading the descending triangle, a clear strategy is essential. Here’s how you can approach it:
Entry Point: The most common entry point is when the price breaks below the horizontal support level. A decisive close beneath this support confirms the pattern’s validity. Traders should ideally wait for a breakout accompanied by higher volume, which adds confidence to the signal.
Stop Loss: Place a stop loss above the most recent lower high or the descending resistance line to protect against false breakouts. This ensures that if the breakout reverses, your position is protected.
Profit Target: Measure the height of the triangle from its widest point (from the resistance line to the support line). Subtract this distance from the breakout point to estimate the expected price target. For example, if the height of the triangle is 5 units and the price breaks out at 50, the target would be 45.
How the Pattern Forms and Why It Occurs
The descending triangle forms because of the interaction between supply and demand in the market. As the price fluctuates, the horizontal support level represents where buying interest is temporarily strong enough to prevent further declines.
On the other hand, the downward-sloping resistance line suggests that selling pressure is increasing, as sellers are willing to accept lower prices.
As the price narrows toward the apex of the triangle, selling momentum often increases. Eventually, the support level may give way, leading to a continuation of the downtrend.
Common Pitfalls to Avoid
While the descending triangle is a reliable pattern, there are a few mistakes traders should watch out for:
False Breakouts: Not all breakouts lead to significant price movements. False breakouts can occur, especially in volatile markets. Always confirm breakouts with an increase in volume to reduce the risk of entering a failed trade.
Premature Entries: Entering the trade too early, before the breakout is confirmed, can lead to unreliable results. Patience is key. It’s generally better to wait for a clear breakdown below the support level and a retest, if possible.
Ignoring Broader Market Trends: The descending triangle is most reliable when it aligns with the broader market trend. If the overall market is bullish, a descending triangle may not be as reliable as a bearish signal.
Volume Confirmation and Breakout Signals
A critical point in trading the descending triangle is the volume. During the formation of the pattern, volume typically contracts. This is normal, as fewer market participants are engaged during the consolidation phase.
However, when the price breaks below the support line, a sharp increase in volume is the strongest confirmation of the breakout. A breakout without volume or with low volume may signal a false move, which is why traders often wait for a confirmed breakout before taking action.
Symmetrical vs. Descending Triangle
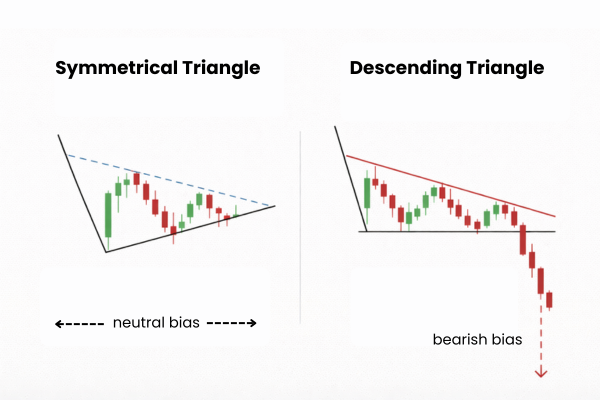
It is important to distinguish the descending triangle pattern from other triangle formations in technical analysis, particularly the symmetrical triangle and the ascending triangle. While all three patterns involve converging trendlines, they signal different market conditions and potential breakout directions.
In contrast, the symmetrical triangle reflects market indecision, with the price consolidating between two trendlines, one sloping upward and the other downward. The symmetrical triangle can break in either direction and is typically a neutral pattern.
Pattern Duration and Timeframe
The descending triangle pattern often takes several weeks or even months to form, particularly on higher timeframes (such as the 4-hour or daily charts). A well-formed triangle, with at least two touches on each trendline, offers a more reliable signal than a pattern that forms too quickly.
Short-term charts (e.g., 5-minute or 1-minute) may not offer dependable signals due to market noise.
Conclusion
The descending triangle pattern is one of the most effective tools for identifying potential bearish breakouts. By carefully watching for the key characteristics of lower highs, flat support, and volume contraction, traders can confidently spot and trade this pattern.
However, it’s important to remember that no pattern is foolproof. Always confirm the breakout with volume and consider the broader market trends to improve your trading strategy.
FAQs
What does the descending triangle pattern indicate?
The descending triangle is a bearish continuation pattern that suggests increased selling pressure and a potential breakdown below support, continuing the downtrend.
How do I trade using the descending triangle?
Enter a trade when the price breaks below the horizontal support line, placing a stop loss above the most recent lower high. The profit target is estimated by measuring the height of the triangle.
Can the descending triangle pattern fail?
Yes, false breakouts can occur, especially if the breakout is not confirmed by increased volume. It’s essential to verify the pattern with additional indicators and volume confirmation.
Share Now
Disclaimer:This content is provided for informational purposes only and does not constitute, and should not be construed as, financial, investment, or other professional advice. No statement or opinion contained herein should be considered a recommendation by Ultima Markets or the author regarding any specific investment product, strategy, or transaction. Readers are advised not to rely solely on this material when making investment decisions and should seek independent advice where appropriate.
Thank you for visiting the Ultima Markets website. Please note that this website is intended for individuals residing in jurisdictions where access is permitted by law. Ultima and its affiliated entities do not operate in your home jurisdiction.
By clicking ‘Acknowledge’, you confirm that you are entering this website solely on your own initiative and not as a result of any specific marketing outreach. You wish to obtain information from this website based on reverse solicitation principles, in accordance with the applicable laws of your home jurisdiction.