This website is managed by Ultima Markets’ international entities, and it’s important to emphasise that they are not subject to regulation by the FCA in the UK. Therefore, you must understand that you will not have the FCA’s protection when investing through this website – for example:
You will not be guaranteed Negative Balance Protection
You will not be protected by FCA’s leverage restrictions
You will not have the right to settle disputes via the Financial Ombudsman Service (FOS)
You will not be protected by Financial Services Compensation Scheme (FSCS)
Any monies deposited will not be afforded the protection required under the FCA Client Assets Sourcebook. The level of protection for your funds will be determined by the regulations of the relevant local regulator.
Note: UK clients are kindly invited to visit https://www.ultima-markets.co.uk/. Ultima Markets UK expects to begin onboarding UK clients in accordance with FCA regulatory requirements in 2026.
If you would like to proceed and visit this website, you acknowledge and confirm the following:
1.The website is owned by Ultima Markets’ international entities and not by Ultima Markets UK Ltd, which is regulated by the FCA.
2.Ultima Markets Limited, or any of the Ultima Markets international entities, are neither based in the UK nor licensed by the FCA.
3.You are accessing the website at your own initiative and have not been solicited by Ultima Markets Limited in any way.
4.Investing through this website does not grant you the protections provided by the FCA.
5.Should you choose to invest through this website or with any of the international Ultima Markets entities, you will be subject to the rules and regulations of the relevant international regulatory authorities, not the FCA.
Ultima Markets wants to make it clear that we are duly licensed and authorised to offer the services and financial derivative products listed on our website. Individuals accessing this website and registering a trading account do so entirely of their own volition and without prior solicitation.
By confirming your decision to proceed with entering the website, you hereby affirm that this decision was solely initiated by you, and no solicitation has been made by any Ultima Markets entity.
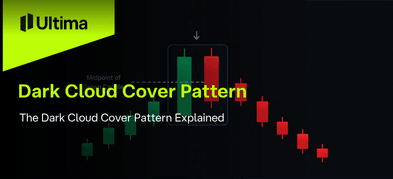
Learn what the dark cloud cover pattern means, how to identify it, how reliable it is, and how traders use confirmation, stop-losses, and support levels.
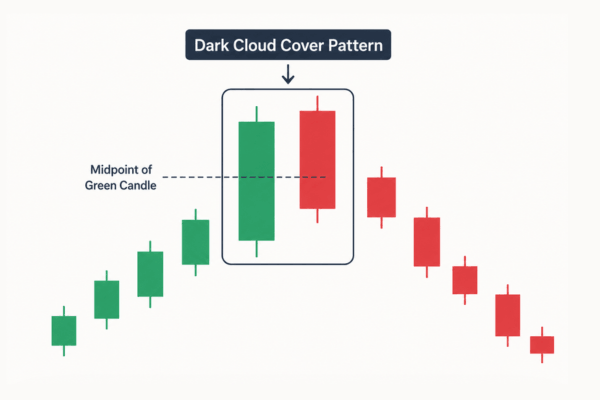
The dark cloud cover pattern is a bearish candlestick pattern that can warn traders of a possible shift in market direction. It usually appears after an uptrend, when buyers seem to be in control, but sellers suddenly push the price lower before the candle closes.
This change in behaviour can suggest that bullish momentum is weakening. For traders, the pattern can act as an early warning that the market may be preparing for a reversal or pullback.
However, the dark cloud cover pattern should not be treated as a guaranteed sell signal. It works best when it is confirmed by other technical tools, such as resistance levels, volume, RSI, moving averages or a further bearish candle.
Used correctly, the pattern can help traders analyse price action, understand market sentiment and manage risk more carefully.
What Is the Dark Cloud Cover Pattern?
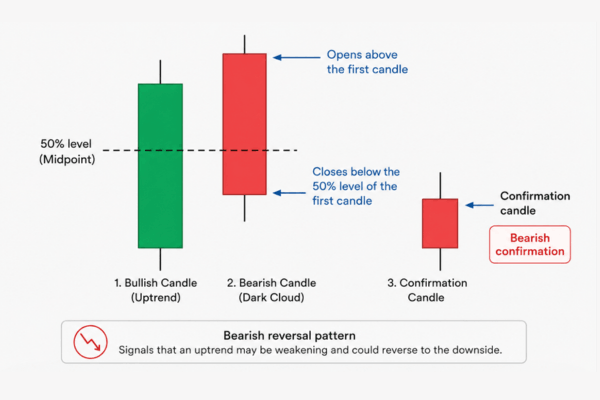
The dark cloud cover pattern is a two-candlestick bearish reversal pattern. It forms when a bullish candle is followed by a bearish candle that opens higher but closes below the midpoint of the previous bullish candle. This structure shows a shift from buying pressure to selling pressure.
How the pattern gets its name
The name comes from the idea of a dark cloud covering a previously bright or bullish candle. In simple terms, the first candle shows optimism, while the second candle shows that sellers have stepped in strongly enough to challenge that optimism.
When it matters most
The pattern is most useful after a clear upward move. If it appears in a sideways or choppy market, it is usually less meaningful because there is no strong bullish trend to reverse.
A strong setup often appears near resistance, after a sharp rally or when the market looks overextended.
How to Identify the Dark Cloud Cover Pattern
To identify the dark cloud cover pattern, traders should look for a specific two-candle structure. The pattern is not simply any bearish candle after a bullish candle. The second candle must close below the midpoint of the first candle.
Checklist to identify the pattern
Requirement
What to look for
Prior trend
The market should be moving upward before the pattern forms
First candle
A strong bullish candle with a clear real body
Second candle open
The second candle opens above the previous close or high
Second candle close
The candle turns bearish and closes below the midpoint of the first candle
Market context
The signal is stronger near resistance or after an extended rally
The deeper the second candle closes into the first candle’s body, the stronger the bearish message may be. A candle that only barely closes below the midpoint may still qualify, but it is usually weaker than one that closes much lower.
Market psychology behind the pattern
The psychology behind the pattern is simple.
During the first candle, buyers are confident. The price rises and the market appears strong. At the start of the second candle, the market opens higher, which may attract even more buyers.
Then the mood changes. Sellers enter aggressively and push the price down. By the close, the second candle has fallen deep into the previous bullish candle. This failed bullish move is what makes the dark cloud cover pattern important.
How Reliable Is the Dark Cloud Cover Pattern?
The dark cloud cover pattern can be useful, but it is not perfect. Pattern researcher Thomas Bulkowski reports that the pattern acts as a bearish reversal around 60% of the time in a bull market. He also ranks it 22nd out of 103 candlestick patterns for overall performance after breakout.
This means the pattern can provide useful information, but traders should still be selective. It should be treated as a warning sign rather than a complete trading system.
Strong vs weak dark cloud cover setups
Strong setup
Weak setup
Forms after a clear uptrend
Appears in a sideways market
Forms near resistance
Forms in the middle of a range
First candle has a strong bullish body
Candles are small or unclear
Second candle closes well below the midpoint
Second candle barely passes the midpoint
Selling volume increases
Volume is low or flat
Followed by bearish confirmation
Price quickly moves higher again
A strong setup shows a clear change in control from buyers to sellers. A weak setup, on the other hand, may only show temporary hesitation in the market.
Why confirmation matters
Confirmation helps reduce false signals. Traders often look for a third bearish candle, a break below support, higher selling volume, bearish RSI divergence or a move below a short-term moving average.
Investopedia notes that traders often wait for the next candle to continue lower before treating the pattern as confirmed. It also highlights that the pattern is more useful when both candles have large real bodies and the market has already been rising.
How Traders Can Use the Pattern
Traders use the dark cloud cover pattern in different ways. Some use it as a warning to protect existing long positions, while others use it to prepare for a possible short trade.
The key is to avoid reacting too quickly. A pattern may look bearish at first, but if the next candle rises strongly, the signal may fail.
Entry, stop-loss and target ideas
A more aggressive trader may enter near the close of the second bearish candle. A more cautious trader may wait for the next candle to close lower or for the price to break below the pattern low.
Common trade planning methods include:
Entry: after a confirmation candle or break below the pattern low
Stop-loss: above the high of the pattern or above the second candle
Profit target: near support, a previous swing low or a planned risk-reward level
Exit signal: if price moves back above the pattern high
The pattern does not provide a built-in profit target, so traders need another method to decide where to exit. Support and resistance levels are often useful for this.
Stocks, forex and crypto
The dark cloud cover pattern can appear in stocks, forex, commodities, futures and crypto markets.
In stocks, the opening gap and volume can be especially useful because markets have set trading hours. A gap up followed by a bearish close can show a strong rejection of higher prices.
In forex and crypto, textbook gaps may be less common because these markets trade for longer hours. In these markets, traders often focus more on the underlying behaviour: price moves higher, buyers fail to hold control, and sellers push the candle deep into the previous bullish body.
Dark cloud cover vs bearish engulfing pattern
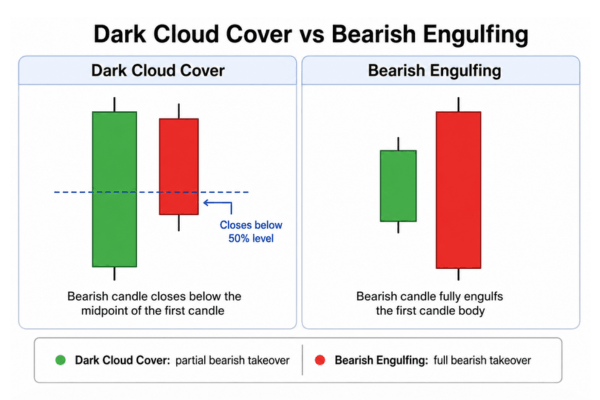
The dark cloud cover pattern is often compared with the bearish engulfing pattern. Both are bearish reversal signals that appear after an uptrend, but they are not the same.
Pattern
Main difference
Dark cloud cover
The second candle closes below the midpoint of the first candle
Bearish engulfing
The second candle fully covers the body of the first candle
Because the bearish engulfing pattern completely covers the previous candle’s body, many traders see it as a stronger reversal signal. The dark cloud cover pattern is often viewed as an earlier warning that momentum may be changing.
Common mistakes to avoid
One common mistake is identifying the pattern without a prior uptrend. Without an upward move first, there is no meaningful bullish trend to reverse.
Another mistake is entering before confirmation. The pattern can fail, especially during strong bull markets, so traders should wait for further evidence where possible.
Traders should also avoid using the pattern alone. Support and resistance, volume, momentum indicators and the wider trend all help provide context.
Conclusion
The dark cloud cover pattern is a useful bearish reversal signal that helps traders recognise a possible shift from buying pressure to selling pressure. It forms after an uptrend when a bullish candle is followed by a bearish candle that opens higher but closes below the midpoint of the previous candle.
The pattern is most effective when it appears near resistance, after a strong rally and with confirmation from price action, volume or indicators.
Although historical research suggests that it can be useful, it should never be used as a standalone trading signal. The best approach is to treat the pattern as a warning sign and combine it with a clear trading plan, proper risk management and confirmation.
FAQs
Is the dark cloud cover pattern bullish or bearish?
It is bearish. It suggests that sellers may be starting to overpower buyers.
What confirms a dark cloud cover pattern?
A lower follow-up candle, support break, rising selling volume or bearish indicator signal can confirm it.
Where does the dark cloud cover pattern appear?
It usually appears after an uptrend, often near a resistance level.
Share Now
Disclaimer:This content is provided for informational purposes only and does not constitute, and should not be construed as, financial, investment, or other professional advice. No statement or opinion contained herein should be considered a recommendation by Ultima Markets or the author regarding any specific investment product, strategy, or transaction. Readers are advised not to rely solely on this material when making investment decisions and should seek independent advice where appropriate.
Thank you for visiting the Ultima Markets website. Please note that this website is intended for individuals residing in jurisdictions where access is permitted by law. Ultima and its affiliated entities do not operate in your home jurisdiction.
By clicking ‘Acknowledge’, you confirm that you are entering this website solely on your own initiative and not as a result of any specific marketing outreach. You wish to obtain information from this website based on reverse solicitation principles, in accordance with the applicable laws of your home jurisdiction.