This website is managed by Ultima Markets’ international entities, and it’s important to emphasise that they are not subject to regulation by the FCA in the UK. Therefore, you must understand that you will not have the FCA’s protection when investing through this website – for example:
You will not be guaranteed Negative Balance Protection
You will not be protected by FCA’s leverage restrictions
You will not have the right to settle disputes via the Financial Ombudsman Service (FOS)
You will not be protected by Financial Services Compensation Scheme (FSCS)
Any monies deposited will not be afforded the protection required under the FCA Client Assets Sourcebook. The level of protection for your funds will be determined by the regulations of the relevant local regulator.
Note: UK clients are kindly invited to visit https://www.ultima-markets.co.uk/. Ultima Markets UK expects to begin onboarding UK clients in accordance with FCA regulatory requirements in 2026.
If you would like to proceed and visit this website, you acknowledge and confirm the following:
1.The website is owned by Ultima Markets’ international entities and not by Ultima Markets UK Ltd, which is regulated by the FCA.
2.Ultima Markets Limited, or any of the Ultima Markets international entities, are neither based in the UK nor licensed by the FCA.
3.You are accessing the website at your own initiative and have not been solicited by Ultima Markets Limited in any way.
4.Investing through this website does not grant you the protections provided by the FCA.
5.Should you choose to invest through this website or with any of the international Ultima Markets entities, you will be subject to the rules and regulations of the relevant international regulatory authorities, not the FCA.
Ultima Markets wants to make it clear that we are duly licensed and authorised to offer the services and financial derivative products listed on our website. Individuals accessing this website and registering a trading account do so entirely of their own volition and without prior solicitation.
By confirming your decision to proceed with entering the website, you hereby affirm that this decision was solely initiated by you, and no solicitation has been made by any Ultima Markets entity.
Learn how to screen for the most oversold stocks using RSI, volume, support and fundamentals to spot rebounds early and avoid value traps for traders.
The phrase most oversold stocks attracts attention for a simple reason. When a stock has fallen sharply, it can look like a bargain. Traders start watching for a bounce, while longer-term investors begin asking whether the market has pushed the price too low.
That said, an oversold stock is not automatically a good opportunity. Sometimes the sell-off is driven by panic or short-term weakness. Other times, the stock is falling because the company’s outlook has genuinely worsened. This is why the best approach is to treat oversold signals as the start of your research, not the end of it.
What Does Oversold Mean?
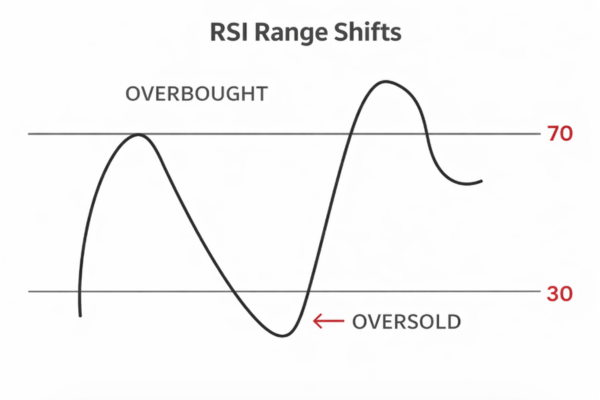
A stock is usually called oversold when heavy selling has pushed momentum indicators into extreme territory. The most widely used tool for spotting this is the Relative Strength Index, or RSI.
RSI measures the speed and size of recent price moves on a scale from 0 to 100. In general, a reading below 30 is seen as oversold, while a reading above 70 is seen as overbought. The standard setting uses 14 periods. Importantly, RSI is a momentum indicator, not a direct measure of value.
Why RSI matters
A low RSI tells you that sellers have been in control. It can suggest that downside momentum is stretched and that a rebound may be possible.
However, RSI does not tell you why the stock fell. It also does not guarantee that the decline is over. In strong downtrends, a stock can remain oversold for longer than many investors expect. Investopedia notes that traders often combine RSI with other tools because oversold readings alone can produce false signals.
Why Current Market Context Matters
It is important to look at oversold stocks in the context of the wider market. A stock that looks washed out during a broad market panic can be very different from a stock that is weak while the rest of the market is recovering.
That distinction matters even more now. Schwab recently noted that the S&P 500 moved from an RSI below 30 to 73 in just 13 trading days, showing how quickly the broader market swung from oversold to overbought conditions.
What this means for investors
This tells us that the market as a whole may no longer be broadly oversold. Instead, better opportunities may now be found in individual stocks or sectors where selling pressure remains unusually strong.
In practice, this means investors should be more selective. Rather than asking whether the whole market is cheap, it makes more sense to ask which stocks still look technically stretched and whether their business fundamentals remain intact.
Current Examples of Most Oversold Stocks
Oversold lists change every day, so any names should be treated as a snapshot rather than a recommendation. Still, live examples help show what “most oversold stocks” actually looks like in the market.
A large-cap oversold list from 17 April 2026 included ConocoPhillips, Chevron, Kinder Morgan, AT&T, and Verizon, all with 14-day RSI readings below 30. In that same screen, ConocoPhillips, Chevron, and Kinder Morgan were shown at around 22 RSI, while AT&T and Verizon were around 25.
Why these examples are useful
These names show that oversold stocks are not limited to tiny speculative companies. Large, established businesses can also become oversold when a sector weakens, commodity prices move against them, or investors rotate into other parts of the market.
This is especially true in sectors such as energy, where prices can react quickly to oil movements, inflation expectations, and geopolitical headlines.
Example Stock
Sector
14-Day RSI on 17 April 2026
ConocoPhillips
Energy
22
Chevron
Energy
22
Kinder Morgan
Energy
22
AT&T
Communication Services
25
Verizon
Communication Services
25
Source based on ABG Analytics oversold screen.
Most Oversold Does Not Always Mean Best Opportunity
This is where many investors go wrong. The stocks with the lowest RSI are not always the most attractive opportunities.
Oversold vs undervalued
An oversold stock is identified through technical analysis. An undervalued stock is identified through fundamental analysis.
A stock can be oversold because the market overreacted. It can also be oversold because earnings are deteriorating, debt is rising, or management has lowered guidance. In other words, a low RSI may reflect fear, but it may also reflect real business weakness.
Term
What It Means
Main Risk
Oversold
Price momentum has fallen sharply
It may keep falling
Undervalued
The stock may trade below its estimated fair value
The valuation may be wrong
Oversold and undervalued
Technical weakness plus potential fundamental value
Still needs a catalyst
Why quality filters matter
This is why stronger competitor-style screens use more than RSI alone. A recent Investing.com analysis of oversold stocks used filters such as market capitalisation above $1 billion, shares down more than 25% this year, prices near 52-week lows, 14-day RSI in oversold territory, fair value upside above 30%, and a minimum financial health score.
That is a much better framework than simply sorting by the lowest RSI and buying the first name on the list.
How to Screen for Most Oversold Stocks
If you want to build a more useful oversold watchlist, the screening process should move from broad to specific.
Start with the basic oversold filter
Begin with RSI below 30. This gives you a first list of technically oversold stocks.
From there, refine the list. For example, Investing.com’s oversold screener applies a market-cap filter above $50 million, which helps remove some extremely small and speculative names.
Add practical filters
Use the next layer of checks to improve quality:
Market cap: helps reduce noise from tiny, illiquid stocks
Volume: higher volume often means better liquidity and stronger signal quality
Trend: check whether the stock is still below its 50-day and 200-day moving averages
Support levels: see whether buyers have stepped in around a known price zone
Fundamentals: review earnings, debt, cash flow, and guidance
Catalyst: ask what could realistically drive a rebound
Look for confirmation, not just weakness
Many traders prefer not to buy while RSI is still falling. Instead, they wait for some sign that momentum is stabilising, such as:
RSI moving back above 30
This can suggest that the most aggressive selling has started to fade.
Bullish MACD crossover
MACD is often used alongside RSI to help spot momentum shifts and possible reversals.
Price holding support
If a stock stops falling near a known support area, it may suggest buyers are stepping in.
A simple oversold stock checklist
Question
Why It Matters
Why did the stock fall?
Temporary fear is very different from structural weakness
Is RSI below 30?
Confirms technical oversold status
Has selling pressure started to ease?
Helps avoid buying too early
Are earnings and cash flow stable?
Stronger businesses recover more easily
Is debt manageable?
High debt adds risk during weak periods
Is there a clear catalyst?
A rebound usually needs a reason
Conclusion
The most oversold stocks can offer interesting trading and investing ideas, but they should never be judged by RSI alone. A low RSI tells you that price momentum has become stretched. It does not tell you whether the business is healthy, whether the stock is cheap, or whether the fall is actually over.
The better approach is to use oversold screens as a shortlist. From there, analyse the company’s fundamentals, sector backdrop, balance sheet, valuation, and possible recovery catalyst.
The best rebound opportunities are usually not the stocks with the very lowest RSI. They are the stocks where technical weakness looks temporary and the underlying business still has reasons to recover.
FAQs
What RSI is considered oversold?
An RSI below 30 is commonly considered oversold.
Are oversold stocks good buys?
Not always. Some rebound, but others keep falling if the underlying business is weak.
What is the best way to screen oversold stocks?
Start with RSI below 30, then add filters for market cap, volume, trend, fundamentals, and catalysts.
Share Now
Disclaimer:This content is provided for informational purposes only and does not constitute, and should not be construed as, financial, investment, or other professional advice. No statement or opinion contained herein should be considered a recommendation by Ultima Markets or the author regarding any specific investment product, strategy, or transaction. Readers are advised not to rely solely on this material when making investment decisions and should seek independent advice where appropriate.
Thank you for visiting the Ultima Markets website. Please note that this website is intended for individuals residing in jurisdictions where access is permitted by law. Ultima and its affiliated entities do not operate in your home jurisdiction.
By clicking ‘Acknowledge’, you confirm that you are entering this website solely on your own initiative and not as a result of any specific marketing outreach. You wish to obtain information from this website based on reverse solicitation principles, in accordance with the applicable laws of your home jurisdiction.