This website is managed by Ultima Markets’ international entities, and it’s important to emphasise that they are not subject to regulation by the FCA in the UK. Therefore, you must understand that you will not have the FCA’s protection when investing through this website – for example:
You will not be guaranteed Negative Balance Protection
You will not be protected by FCA’s leverage restrictions
You will not have the right to settle disputes via the Financial Ombudsman Service (FOS)
You will not be protected by Financial Services Compensation Scheme (FSCS)
Any monies deposited will not be afforded the protection required under the FCA Client Assets Sourcebook. The level of protection for your funds will be determined by the regulations of the relevant local regulator.
Note: UK clients are kindly invited to visit https://www.ultima-markets.co.uk/. Ultima Markets UK expects to begin onboarding UK clients in accordance with FCA regulatory requirements in 2026.
If you would like to proceed and visit this website, you acknowledge and confirm the following:
1.The website is owned by Ultima Markets’ international entities and not by Ultima Markets UK Ltd, which is regulated by the FCA.
2.Ultima Markets Limited, or any of the Ultima Markets international entities, are neither based in the UK nor licensed by the FCA.
3.You are accessing the website at your own initiative and have not been solicited by Ultima Markets Limited in any way.
4.Investing through this website does not grant you the protections provided by the FCA.
5.Should you choose to invest through this website or with any of the international Ultima Markets entities, you will be subject to the rules and regulations of the relevant international regulatory authorities, not the FCA.
Ultima Markets wants to make it clear that we are duly licensed and authorised to offer the services and financial derivative products listed on our website. Individuals accessing this website and registering a trading account do so entirely of their own volition and without prior solicitation.
By confirming your decision to proceed with entering the website, you hereby affirm that this decision was solely initiated by you, and no solicitation has been made by any Ultima Markets entity.
Discover the Heikin Ashi strategy in 5 minutes to read the Heikin Ashi candles like a pro, catch trend reversals early, and maximise your trading profits.
Master the Heikin Ashi Strategy in 5 Mins
Want to trade smarter and spot trends before others do? The Heikin Ashi strategy helps you see the market more clearly, highlighting trend direction and potential high-probability setups.
In this guide, you’ll learn how to read Heikin Ashi candles, recognise key signals, and use them to make informed trading decisions with confidence.
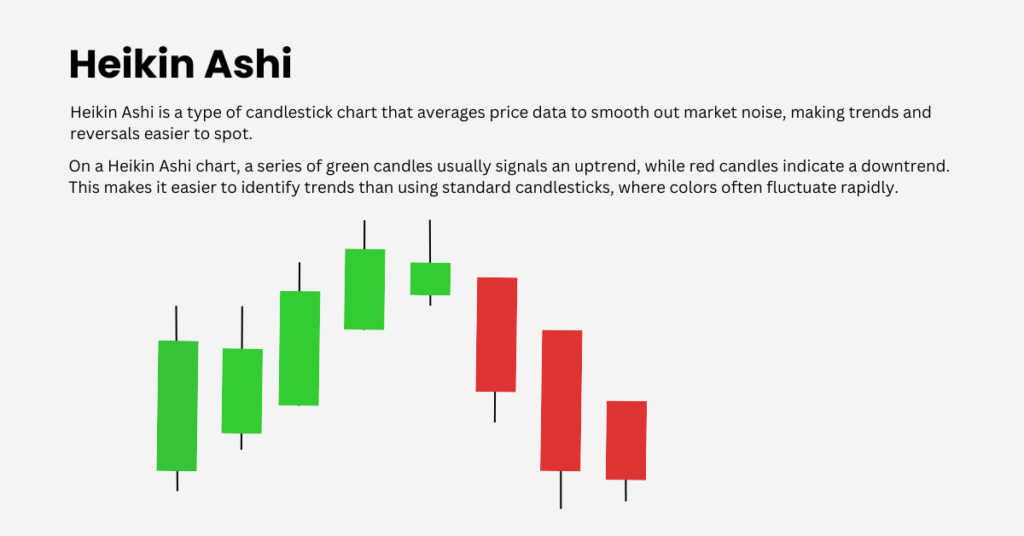
What is the Heikin Ashi?
The term “Heikin Ashi” translates to “average bar,” and it reflects the candle’s unique construction. Each candle is calculated using the average price of the open, high, low, and close, which smooths out volatility and highlights the true direction of the trend.
The heikin ashi open is determined by averaging the open and close prices from the previous period, while the heikin ashi close is calculated by averaging the current period’s open, high, low, and closing prices. This use of close prices and historical prices from the previous period helps filter out market noise and provides a clearer view of price trends.
In contrast, a standard candlestick on a traditional candlestick chart display raw price movements, including actual opening, closing, high, and low prices, which can appear choppy or erratic. Heikin Ashi, by incorporating historical prices and averaging techniques, offers a smoother, more trend-focused visualisation.
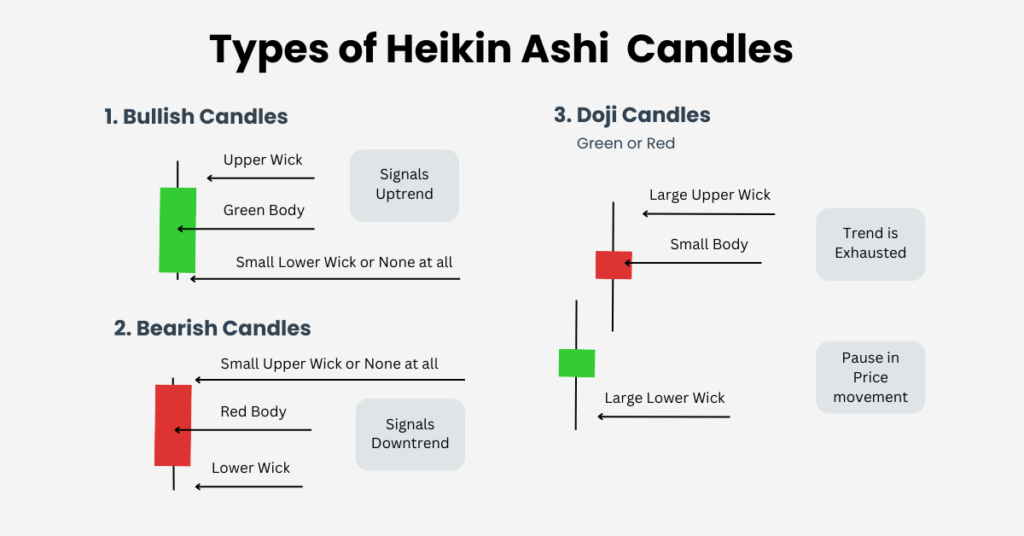
3 Types of Heikin Ashi Candles
Heikin Ashi candles fall into three main types:
Bullish candles: Solid green bodies, little or no lower wick. Signals strong buying momentum and an upward trend. Ideal for entwherering long trades.
Bearish candles: Red bodies, little or no upper wick. Indicates strong selling pressure and a downtrend, suitable for short trades.
Doji candles: Small bodies with wicks on both ends. Demonstrates indecision, trend exhaustion, or consolidation, often preceding reversals.
Recognising these candle types is essential to understanding trend strength and spotting possible reversals.
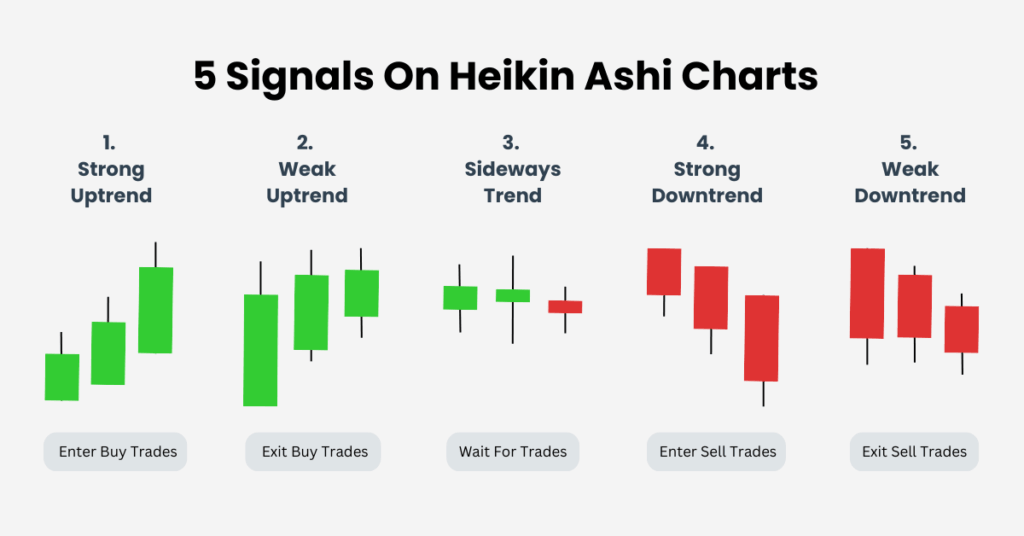
Spotting Trading Opportunities with Heikin Ashi
Heikin Ashi candles are most effective when combined with key market context like support and resistance levels or moving averages. Here’s how traders can interpret the signals:
Strong uptrend: Consecutive green candles with no lower wick, each candle getting larger. Often a signal to enter buy trades, especially if price pulls back to a support level.
Weak uptrend: Green candles shrink or develop lower wicks, signaling a slowdown in momentum. Traders may exit buy trades or tighten stops.
Sideways trend: Multiple Doji candles indicate consolidation. Wait for a breakout candle in either direction before trading.
Strong downtrend: Consecutive red candles with no upper wick, each candle growing. This suggests strong selling momentum and a potential short trade.
Weak downtrend: Red candles shrink or develop upper wicks, signaling fading momentum. Consider closing short trades or adjusting stops.
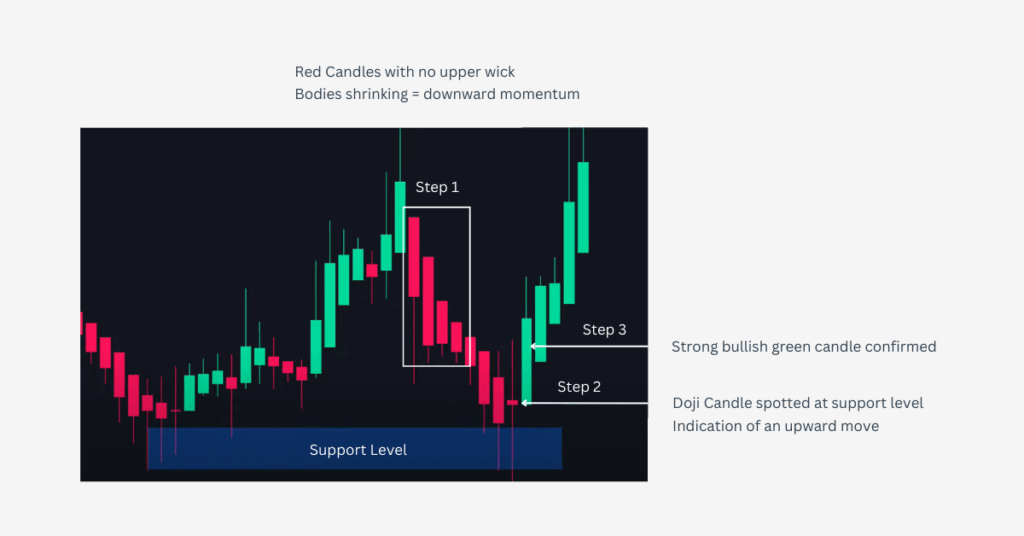
Heikin Ashi Strategy in Action
To see the Heikin Ashi strategy at work, let’s examine a real trading scenario and how combining candle signals with price action can highlight a potential trade.
Imagine the price is approaching a support level where it has reversed before. Here’s how you can use Heikin Ashi candles to spot a trading opportunity:
Step 1: Identify Weak Downtrend
Observe red Heikin Ashi candles as the price nears the support.
Check the candle bodies: if they shrink instead of growing, it shows the downward move is losing momentum.
Small or absent upper wicks also signal weak selling pressure.
Step 2: Spot Potential Reversal
Look for a Doji candle at the support level with long upper and lower wicks.
This indicates market indecision and confirms the support level is holding.
The probability of an upward move increases from this point.
Step 3: Confirm Uptrend and Enter Trade
Wait for a strong bullish green candle with a large body and no lower wick.
This signals buyers are in control and the price is likely to rise.
Trade setup:
Entry: At the close of the bullish candle
Stop Loss: Below the candle’s low
Target: Next resistance level
By following these three steps, traders can turn Heikin Ashi signals and support/resistance levels into a high-probability trade setup.
Limitations of the Heikin Ashi Strategy
While Heikin Ashi charts are excellent for reducing market noise and highlighting trends, it’s important to recognise their limitations. One of the main drawbacks of the Heikin Ashi technique is that the averaging process can cause a lag in reflecting real-time price movements. This means that entry and exit points may be delayed, potentially causing you to miss the optimal moment for a trade.
Another limitation that may arise is that Heikin Ashi charts can also struggle in sideways or choppy markets. The smoothing effect that makes trends clearer can also generate false signals when the market lacks clear direction. Additionally, some price data—such as sudden price gaps or sharp spikes—may be obscured, making it harder to react to rapid market changes.
To address these limitations, it is wise to use Heikin Ashi charts alongside other technical indicators, such as moving averages or momentum indicators.
By combining the Heikin Ashi technique with a broader trading strategy, you can improve trend identification, filter out false signals, and refine your entry and exit points for better trading performance.
Conclusion
The Heikin Ashi strategy is not just about spotting trends—it’s about trading with clarity, discipline, and probability in your favor. By utilising the Heikin Ashi chart and applying Heikin Ashi analysis, you can make informed trading decisions that benefit from smoothed market data and clearer trend identification. Combining candle patterns with support/resistance, moving averages, and momentum signals further enhances your ability to manage risk effectively.
Whether you are trading forex, stocks, or commodities, mastering Heikin Ashi can help you filter out noise, capture stronger trends, and trade with confidence.
Share Now
Disclaimer:This content is provided for informational purposes only and does not constitute, and should not be construed as, financial, investment, or other professional advice. No statement or opinion contained herein should be considered a recommendation by Ultima Markets or the author regarding any specific investment product, strategy, or transaction. Readers are advised not to rely solely on this material when making investment decisions and should seek independent advice where appropriate.
Thank you for visiting the Ultima Markets website. Please note that this website is intended for individuals residing in jurisdictions where access is permitted by law. Ultima and its affiliated entities do not operate in your home jurisdiction.
By clicking ‘Acknowledge’, you confirm that you are entering this website solely on your own initiative and not as a result of any specific marketing outreach. You wish to obtain information from this website based on reverse solicitation principles, in accordance with the applicable laws of your home jurisdiction.