This website is managed by Ultima Markets’ international entities, and it’s important to emphasise that they are not subject to regulation by the FCA in the UK. Therefore, you must understand that you will not have the FCA’s protection when investing through this website – for example:
You will not be guaranteed Negative Balance Protection
You will not be protected by FCA’s leverage restrictions
You will not have the right to settle disputes via the Financial Ombudsman Service (FOS)
You will not be protected by Financial Services Compensation Scheme (FSCS)
Any monies deposited will not be afforded the protection required under the FCA Client Assets Sourcebook. The level of protection for your funds will be determined by the regulations of the relevant local regulator.
Note: UK clients are kindly invited to visit https://www.ultima-markets.co.uk/. Ultima Markets UK expects to begin onboarding UK clients in accordance with FCA regulatory requirements in 2026.
If you would like to proceed and visit this website, you acknowledge and confirm the following:
1.The website is owned by Ultima Markets’ international entities and not by Ultima Markets UK Ltd, which is regulated by the FCA.
2.Ultima Markets Limited, or any of the Ultima Markets international entities, are neither based in the UK nor licensed by the FCA.
3.You are accessing the website at your own initiative and have not been solicited by Ultima Markets Limited in any way.
4.Investing through this website does not grant you the protections provided by the FCA.
5.Should you choose to invest through this website or with any of the international Ultima Markets entities, you will be subject to the rules and regulations of the relevant international regulatory authorities, not the FCA.
Ultima Markets wants to make it clear that we are duly licensed and authorised to offer the services and financial derivative products listed on our website. Individuals accessing this website and registering a trading account do so entirely of their own volition and without prior solicitation.
By confirming your decision to proceed with entering the website, you hereby affirm that this decision was solely initiated by you, and no solicitation has been made by any Ultima Markets entity.
Learn the top harmonic patterns in trading, including Gartley, Bat, Butterfly and more. Spot reversals with Fibonacci ratios and trade with confidence.
Mastering Harmonic Patterns in Trading
Markets often move in ways that look random, but beneath the noise are repeating structures shaped by mathematics. Harmonic patterns are one of the clearest examples. By combining geometric price swings with Fibonacci ratios, these patterns help traders spot precise areas where reversals are more likely to occur.
When price reaches this potential reversal zone and reacts, you have a structured setup with defined entries, stops, and targets. In this guide, you’ll learn what harmonic patterns are and why traders use them, discover the seven most common variations, and see how to identify, draw, and trade them with effective risk control.
What are Harmonic Patterns
Harmonic patterns are geometric price structures built from five points labelled X, A, B, C, and D. The XA leg sets the foundation. The next legs retrace or extend that move in specific Fibonacci proportions until D completes the structure. The trade plan is simple: measure the legs, mark the reversal zone, wait for confirmation, then execute with predefined risk.
Unlike looser chart formations, harmonic patterns combine geometry with Fibonacci ratios. This makes them a specialised branch of chart patterns, giving traders a repeatable, rules based way to forecast reversals.
Why Traders use Harmonics
Most chart patterns are subjective. Harmonics reduce guesswork with fixed measurements, so you know where the setup completes, where it is invalid, and how to take profits in stages.
They are especially popular in forex, where fast swings make precise entry and exit levels valuable, but they can be applied to stocks, indices, and commodities as well.
How a Harmonic Forms
Harmonics use five swing points: X, A, B, C, and D. XA is the first impulse. AB and BC retrace parts of the move. CD extends to complete the pattern at D, which becomes the potential reversal zone. If ratios align, watch the PRZ closely. Confirmation may come from a rejection wick, an engulfing candle, or a small break of structure. No reaction means no trade.
Top 8 Harmonic Patterns
Below are the patterns you will use most often. The numbers are standard guidelines presented as retracements or extensions of the previous leg. Treat them as ranges rather than single ticks.
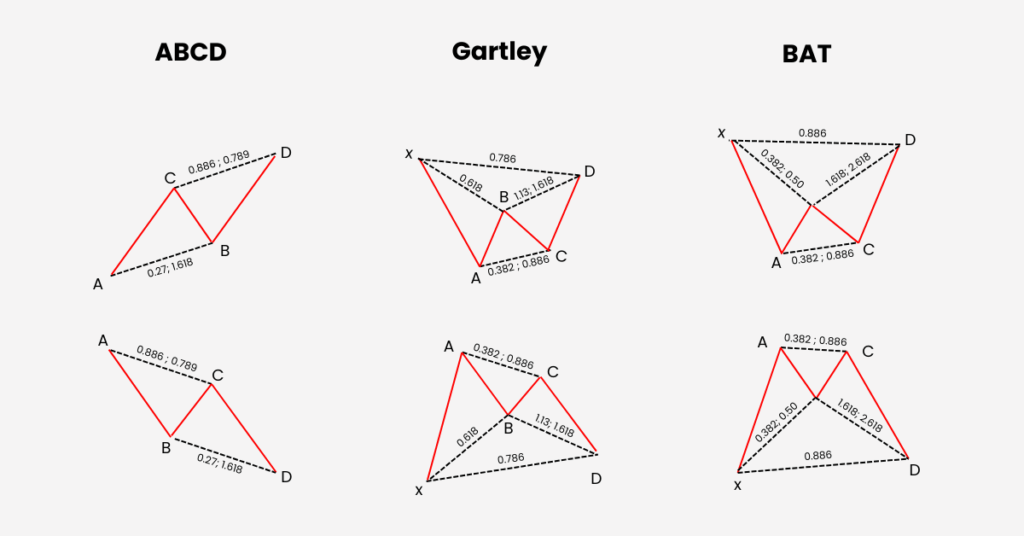
ABCD
Three moves: AB impulse, BC retracement (often near 0.618 of AB), and CD which mirrors AB in length. Entry is either on a reaction around C or at completion near D.
Gartley
B ≈ 0.618 of XA. C = 0.382–0.886 of AB. D ≈ 0.786 of XA, often with AB=CD symmetry. Stops beyond X, with targets at the 38.2 and 61.8 retracements of CD.
Bat
B ≈ 0.382 or 0.50 of XA. C = 0.382–0.886 of AB. BC projection 1.618–2.618. D near 0.886 of XA. Stops can be tucked beyond X, keeping risk tight.
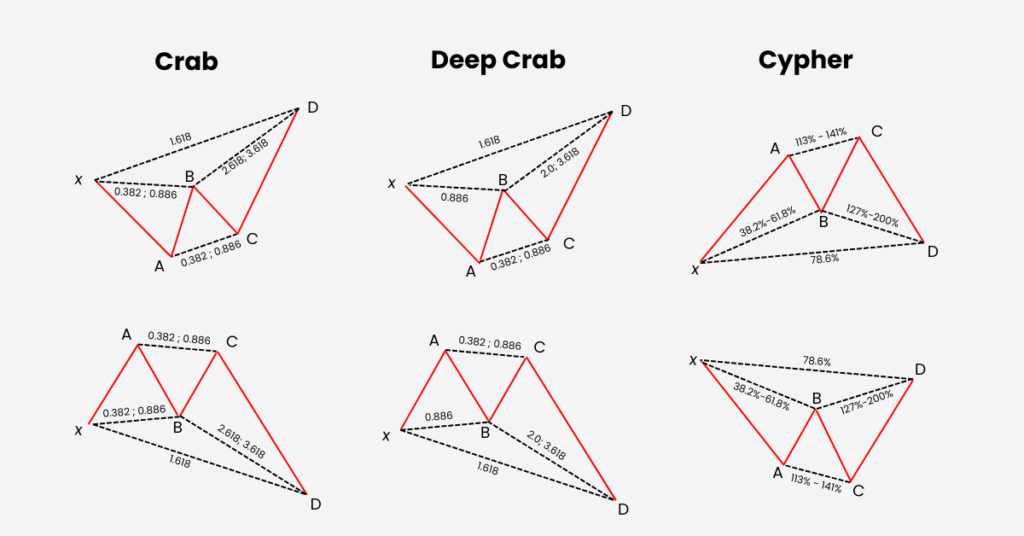
Crab
B ≈ 0.382 or 0.618 of XA. BC projection 2.24–3.618. D near 1.618 XA. Known for sharp reversals, so confirmation is vital.
Deep Crab
Variation with B ≈ 0.886 of XA and the same 1.618 XA target at D.
Cypher
B = 0.382–0.618 of XA. C extends beyond A to 1.272–1.414. D = 0.786 retracement of XC. Because C overshoots A, patience is key while waiting for price to travel back to D.
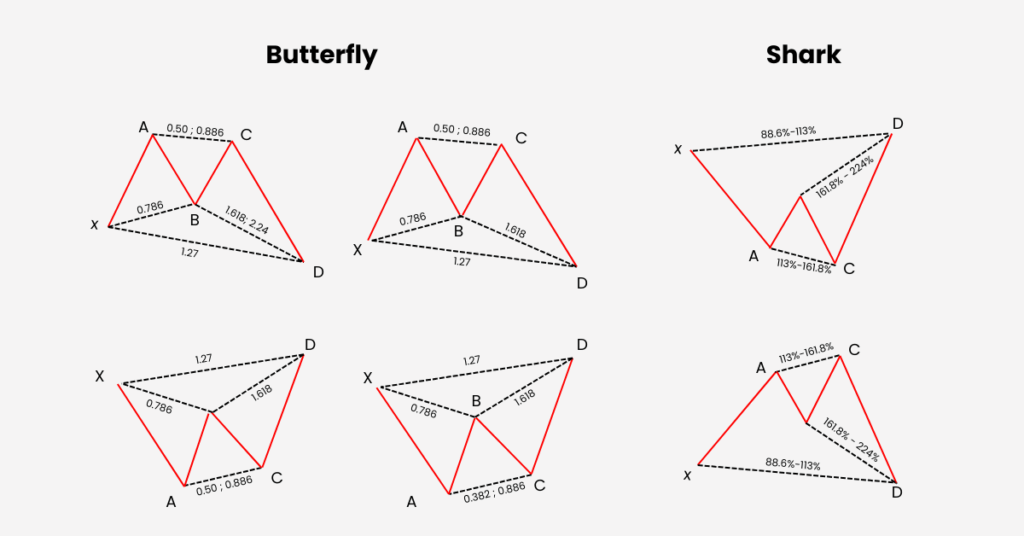
Butterfly
B ≈ 0.786 of XA. Completion extends beyond X. PRZ often clusters around 1.27 XA, stretching to 1.618 XA in stronger moves. AB=CD symmetry improves confidence.
Shark
Introduced by Scott Carney, the Shark uses five points labelled O–X–A–B–X. It shares similarities with the Crab family but has unique ratio rules:
AB = 1.13–1.618 of XA
BC ≈ 1.13 of OX
CD often targets a 50% retracement of BC
Trades are generally managed from point C, while D provides a pre-defined profit target. Because it tends to form quickly, traders often rely on additional confirmation before entry.
How to Identify and Draw Harmonic Patterns
Mark clear swing highs and lows.
Measure each leg with Fibonacci tools.
Check that B, C, and D fit the required ranges.
Define the reversal zone by overlapping the key ratios.
Drop to a lower timeframe and look for confirmation.
Bullish and Bearish Versions
Every harmonic pattern has a bullish and bearish form. A bullish setup completes at the end of a decline and signals a potential push higher. A bearish setup completes after a rise and signals a turn lower. The ratios are the same, simply inverted.
Building A High Quality Reversal Zone
Stronger setups often stack three factors:
The XA retracement/extension for the pattern (e.g., 0.786 XA in Gartley, 1.27 XA in Butterfly)
An AB=CD or alternate AB=CD completion
A BC projection landing in the same area
If these overlap near prior support or resistance, the reversal zone is more reliable.
How to Trade Harmonic Patterns
Entry Either place a limit at the deepest level inside the zone or wait for a confirmed reaction.
Stop loss Always beyond invalidation. For completions beyond X, stops go past the furthest XA extension. For completions inside XA, stops sit beyond X.
Targets Take partial profits at 38.2% and 61.8% retracements of CD, then aim for C and A. Move stops to breakeven after the first target.
Risk Management and Psychology
Even precise patterns can fail. Protect your capital with strict position sizing, logical stop placement, and a positive risk-reward ratio (ideally at least 1:2). Success also depends on discipline. Impulsive entries, early exits, or widening stops destroy the edge. Patience and consistency are as important as pattern recognition.
Common Mistakes
Forcing patterns by eyeballing instead of measuring
Entering before D completes
Ignoring higher timeframe context or news events
Widening stops after entry
Scanners and Platforms
TradingView and MetaTrader provide harmonic scanners that auto-draw potential XABCD structures. Use them to save time, but always verify ratios and context manually before trading.
Conclusion
Harmonic patterns combine geometry with Fibonacci ratios to give traders fixed rules, clear reversal zones, and structured trade plans. They are not guarantees, but when combined with confirmation, risk management, and discipline, they provide a powerful trading framework.
Start small: pick one market, focus on two patterns such as the Gartley and Bat, and keep a detailed trading journal. With practice, you’ll learn which setups suit your style and refine your edge.
Share Now
Disclaimer:This content is provided for informational purposes only and does not constitute, and should not be construed as, financial, investment, or other professional advice. No statement or opinion contained herein should be considered a recommendation by Ultima Markets or the author regarding any specific investment product, strategy, or transaction. Readers are advised not to rely solely on this material when making investment decisions and should seek independent advice where appropriate.
Thank you for visiting the Ultima Markets website. Please note that this website is intended for individuals residing in jurisdictions where access is permitted by law. Ultima and its affiliated entities do not operate in your home jurisdiction.
By clicking ‘Acknowledge’, you confirm that you are entering this website solely on your own initiative and not as a result of any specific marketing outreach. You wish to obtain information from this website based on reverse solicitation principles, in accordance with the applicable laws of your home jurisdiction.