This website is managed by Ultima Markets’ international entities, and it’s important to emphasise that they are not subject to regulation by the FCA in the UK. Therefore, you must understand that you will not have the FCA’s protection when investing through this website – for example:
You will not be guaranteed Negative Balance Protection
You will not be protected by FCA’s leverage restrictions
You will not have the right to settle disputes via the Financial Ombudsman Service (FOS)
You will not be protected by Financial Services Compensation Scheme (FSCS)
Any monies deposited will not be afforded the protection required under the FCA Client Assets Sourcebook. The level of protection for your funds will be determined by the regulations of the relevant local regulator.
Note: UK clients are kindly invited to visit https://www.ultima-markets.co.uk/. Ultima Markets UK expects to begin onboarding UK clients in accordance with FCA regulatory requirements in 2026.
If you would like to proceed and visit this website, you acknowledge and confirm the following:
1.The website is owned by Ultima Markets’ international entities and not by Ultima Markets UK Ltd, which is regulated by the FCA.
2.Ultima Markets Limited, or any of the Ultima Markets international entities, are neither based in the UK nor licensed by the FCA.
3.You are accessing the website at your own initiative and have not been solicited by Ultima Markets Limited in any way.
4.Investing through this website does not grant you the protections provided by the FCA.
5.Should you choose to invest through this website or with any of the international Ultima Markets entities, you will be subject to the rules and regulations of the relevant international regulatory authorities, not the FCA.
Ultima Markets wants to make it clear that we are duly licensed and authorised to offer the services and financial derivative products listed on our website. Individuals accessing this website and registering a trading account do so entirely of their own volition and without prior solicitation.
By confirming your decision to proceed with entering the website, you hereby affirm that this decision was solely initiated by you, and no solicitation has been made by any Ultima Markets entity.
The bullish harami pattern is a two-candle candlestick formation that signals a potential reversal from a downtrend to an uptrend. Learn how to trade it.
How to Trade with a Bullish Harami Pattern
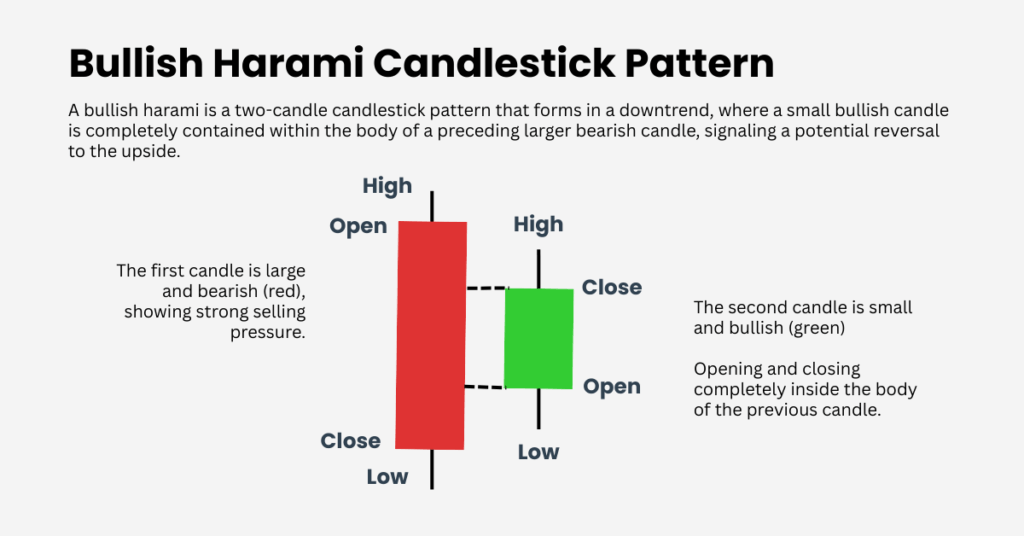
The bullish harami pattern is a two-candle formation that signals a possible reversal from a downtrend to an uptrend. It occurs when a large bearish candle, representing strong selling pressure, is followed by a smaller bullish candle that opens and closes entirely inside the first candle’s body.
What Is a Bullish Harami Pattern?
The name comes from the Japanese word harami, meaning pregnant. Traders often describe the first large red candle as the “mother” and the smaller green candle inside it as the “baby.” This imagery reflects the way the second candle forms within the first, suggesting that sellers are losing momentum while buyers are quietly stepping in.
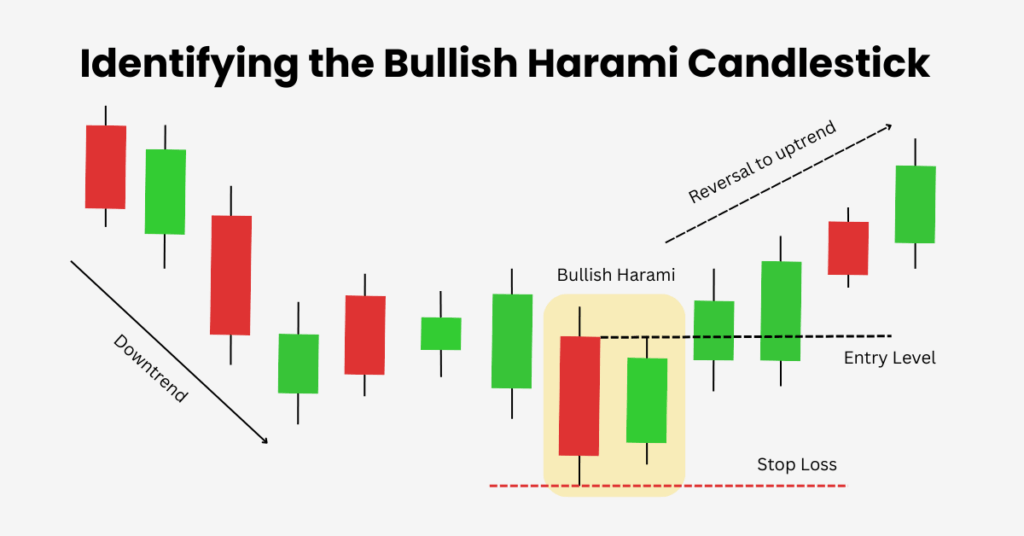
How to Identify the Bullish Harami Pattern on a Chart
Spotting a bullish harami pattern requires a clear downtrend leading into the setup. The first candle should be long and bearish, followed by a smaller bullish candle that remains contained within the previous candle’s body. The pattern becomes more reliable when the next candle closes above the high of the harami, which acts as confirmation.
For added confidence, traders often pair candlestick recognition with technical indicators. For example, if the relative strength index (RSI) is showing oversold conditions or a divergence, and the MACD is turning bullish, then the harami carries more weight. Volume spikes at key support levels can also strengthen the signal.
Bullish Harami Pattern vs Similar Candlestick Patterns
Pattern
Key Difference
Bullish Harami Pattern
Small green candle inside a larger red candle’s body.
Bullish Engulfing
Second candle completely engulfs the first bearish candle.
Inside Bar
Smaller candle inside a larger one, but not always a reversal.
Morning Star
Three-candle reversal pattern, usually with a doji.
How to Trade a Bullish Harami Effectively
Trading the bullish harami pattern requires patience and context. A common approach is to wait for the next candle to close above the high of the harami, confirming bullish strength before entering a buy trade. Stop-loss orders are usually placed just below the pattern’s low, while profit targets are often set at the nearest resistance level or calculated using tools like Fibonacci retracements or the Average True Range (ATR).
It’s important not to rely on candlesticks alone. Pairing the harami with RSI divergence, MACD crossovers, or volume confirmation helps filter out false signals. For example, a bullish harami that appears after an extended downtrend in an oversold market, supported by bullish momentum indicators, is far more reliable than one that forms during a sideways range.
Best Time Frame for the Bullish Harami Pattern
The bullish harami pattern can appear on any chart, but it tends to be more reliable on higher time frames such as daily or weekly candlesticks. Reversals on these charts carry more weight and are less influenced by short-term volatility. On very short time frames like the 1-minute or 5-minute charts, haramis often generate false signals due to noise and whipsaws.
Frequency and Effectiveness of the Bullish Harami Pattern
The bullish harami is a relatively common pattern, especially in volatile markets where strong bearish trends begin to lose steam. Studies suggest its success rate ranges between 60% and 70% when traded with confirmation, though results vary by asset and timeframe. Its effectiveness rises when combined with support/resistance analysis, momentum indicators, and volume.
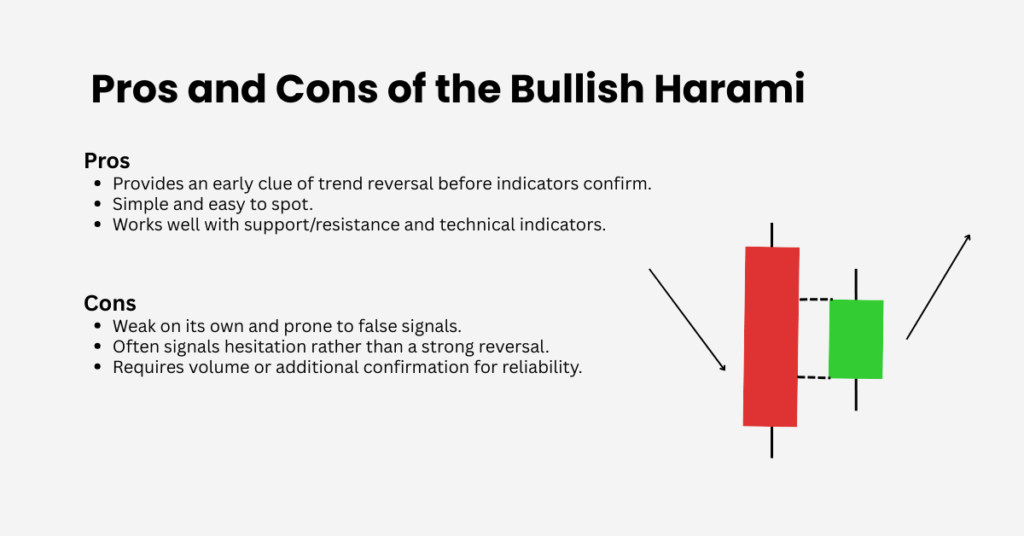
Pros and Cons of the Bullish Harami Pattern
Like any technical setup, the bullish harami pattern has both advantages and limitations. Its biggest strength is that it provides an early clue of a potential reversal before lagging indicators react. It’s also easy to spot and can be very effective when used with support/resistance and momentum indicators.
The drawback is that the pattern is weak on its own. It often signals hesitation rather than a decisive reversal, and without confirmation it can generate false signals. This is especially true in sideways markets or low-volume conditions. For this reason, traders should always treat the bullish harami as one part of a broader trading strategy rather than a standalone system.
Final Thoughts
The bullish harami pattern is a valuable candlestick formation for traders looking to anticipate potential reversals. By itself, it shows that bearish momentum may be fading, but its true strength lies in confirmation. Combined with RSI, MACD, volume analysis, and well-defined support levels, the pattern becomes a practical tool for identifying entry points in forex, stocks, and commodities.
Used wisely, the bullish harami pattern can help traders spot opportunities early and trade with more confidence.
Share Now
Disclaimer:This content is provided for informational purposes only and does not constitute, and should not be construed as, financial, investment, or other professional advice. No statement or opinion contained herein should be considered a recommendation by Ultima Markets or the author regarding any specific investment product, strategy, or transaction. Readers are advised not to rely solely on this material when making investment decisions and should seek independent advice where appropriate.
Thank you for visiting the Ultima Markets website. Please note that this website is intended for individuals residing in jurisdictions where access is permitted by law. Ultima and its affiliated entities do not operate in your home jurisdiction.
By clicking ‘Acknowledge’, you confirm that you are entering this website solely on your own initiative and not as a result of any specific marketing outreach. You wish to obtain information from this website based on reverse solicitation principles, in accordance with the applicable laws of your home jurisdiction.