This website is managed by Ultima Markets’ international entities, and it’s important to emphasise that they are not subject to regulation by the FCA in the UK. Therefore, you must understand that you will not have the FCA’s protection when investing through this website – for example:
You will not be guaranteed Negative Balance Protection
You will not be protected by FCA’s leverage restrictions
You will not have the right to settle disputes via the Financial Ombudsman Service (FOS)
You will not be protected by Financial Services Compensation Scheme (FSCS)
Any monies deposited will not be afforded the protection required under the FCA Client Assets Sourcebook. The level of protection for your funds will be determined by the regulations of the relevant local regulator.
Note: UK clients are kindly invited to visit https://www.ultima-markets.co.uk/. Ultima Markets UK expects to begin onboarding UK clients in accordance with FCA regulatory requirements in 2026.
If you would like to proceed and visit this website, you acknowledge and confirm the following:
1.The website is owned by Ultima Markets’ international entities and not by Ultima Markets UK Ltd, which is regulated by the FCA.
2.Ultima Markets Limited, or any of the Ultima Markets international entities, are neither based in the UK nor licensed by the FCA.
3.You are accessing the website at your own initiative and have not been solicited by Ultima Markets Limited in any way.
4.Investing through this website does not grant you the protections provided by the FCA.
5.Should you choose to invest through this website or with any of the international Ultima Markets entities, you will be subject to the rules and regulations of the relevant international regulatory authorities, not the FCA.
Ultima Markets wants to make it clear that we are duly licensed and authorised to offer the services and financial derivative products listed on our website. Individuals accessing this website and registering a trading account do so entirely of their own volition and without prior solicitation.
By confirming your decision to proceed with entering the website, you hereby affirm that this decision was solely initiated by you, and no solicitation has been made by any Ultima Markets entity.
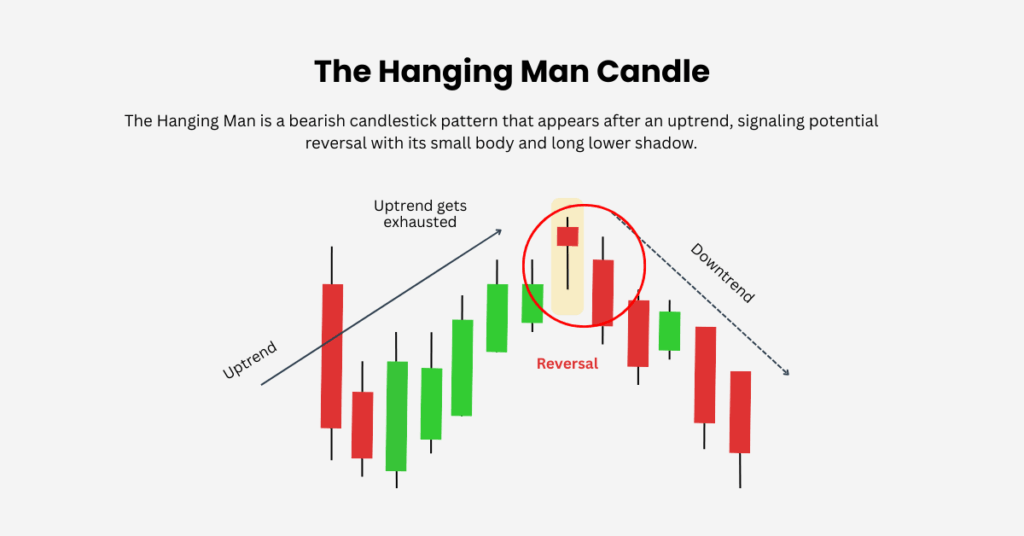
Still don’t know what a hanging man candle is? It is a bearish candlestick pattern that appears after an uptrend, warning traders of a potential reversal.
Hanging Man Candle Explained for Traders
Candlestick patterns are one of the most widely used tools in technical analysis, helping traders anticipate potential reversals and shifts in market sentiment. Among these, the hanging man candle stands out as a clear bearish signal that typically appears at the end of an uptrend. Learning how to recognise and interpret this pattern can give traders an early warning before bullish momentum fades and a downside reversal takes shape.
What Is a Hanging Man Candle?
A hanging man candle is a bearish reversal candlestick pattern that forms after a strong upward move in price. It signals that while buyers have been in control, sellers are beginning to show their presence, creating the possibility of a shift in trend.
The candle itself looks almost identical to the hammer pattern. However, the context in which it appears makes all the difference. The hammer forms at the bottom of a downtrend and suggests a bullish reversal, while the hanging man forms at the top of an uptrend and suggests a bearish reversal.
In both cases, the candle has a small real body near the top of the price range, a long lower shadow that is usually at least twice the size of the body, and little to no upper shadow. A red hanging man tends to carry more bearish weight than a green one, although both are considered valid signals.
How to Identify a Hanging Man Candle
Look for these features:
Appears after a strong uptrend, not in sideways markets.
Small real body near the top of the price range.
Long lower shadow at least twice the size of the body.
Minimal or no upper shadow.
Can be red or green, but red carries more bearish weight.
It is important to note that if this pattern appears without an uptrend, it should not be considered a true hanging man. Traders also need to be careful not to confuse it with other formations, such as the doji, which have different implications.
The Psychology Behind the Pattern
The psychology of the hanging man candle reflects a turning point in the market.
At the start of the session, the uptrend continues as expected, but sellers step in and drive prices sharply lower, leaving behind a long wick. Buyers then attempt to regain control and close the candle near its open, resulting in the small real body. Despite this recovery, the fact that sellers were able to apply significant pressure indicates that the uptrend may be losing steam.
For many traders, the appearance of this candle signals a critical moment to pay closer attention, as a reversal could be around the corner.
How to Trade the Hanging Man Candle
The hanging man candle should be viewed as a warning sign, not a standalone signal. For it to carry weight, confirmation is essential. Traders usually look for a bearish candle closing below the hanging man in the next session to validate the reversal.
Confirm the Trend Ensure the market has been in a strong uptrend before spotting the candle.
Look for Confirmation A bearish candle closing below the hanging man in the next session adds strength to the reversal signal.
Use Indicators for Support Pair the pattern with an indicator such as RSI, MACD, or moving averages to confirm overbought conditions. Use other indicators and other tools, like momentum oscillators or identifying a support level, to further confirm the signal and improve decision-making accuracy.
Plan Entry and Exit
Entry: Consider executing trades (such as short positions) after confirmation.
Stop-loss: Place above the high of the hanging man as part of your risk management strategy.
Take profit: Target a support level or key moving averages.
Proper risk management is crucial when planning trades based on the hanging man pattern to protect your capital and optimise trade outcomes.
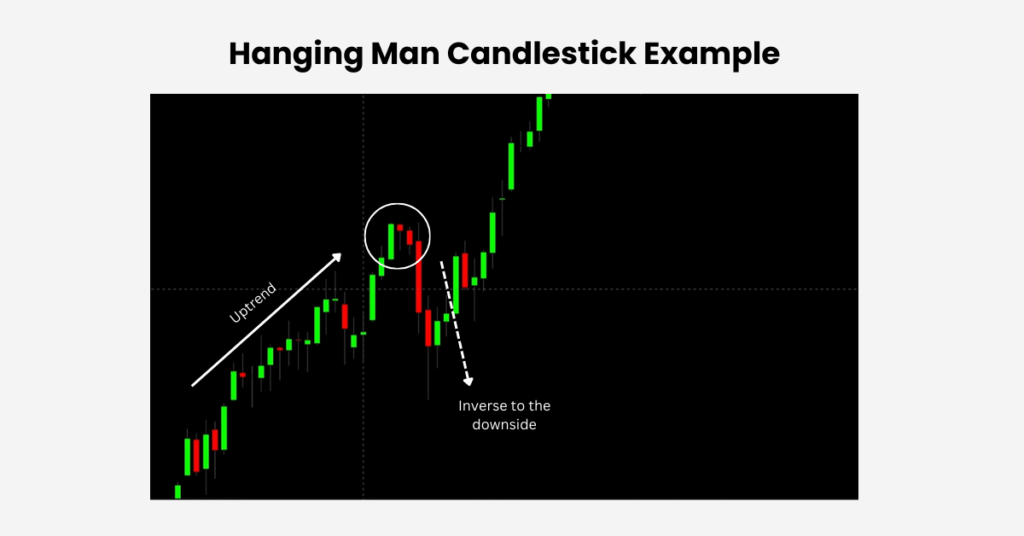
The Hanging Man in Action
Let’s see this chart as an example. The market has been in a steady uptrend, pushing higher session after session. Suddenly, a hanging man candle appears. It has a small real body near the top of the range and a long lower shadow that is more than twice the size of the body. This meets the criteria for a valid hanging man pattern.
Although buyers managed to pull the price back up by the close, the fact that sellers drove it down so aggressively during the session shows that bearish pressure is creeping in. On the very next candle, the market confirms the signal by moving lower, marking the start of a reversal.
This sequence highlights how the hanging man can serve as an early warning sign. On its own it’s just a caution flag, but when it appears after an uptrend and is followed by bearish confirmation, it becomes a powerful clue that momentum may be shifting to the downside.
Limitations of the Hanging Man Candle
Like all candlestick formations, the hanging man is not a perfect predictor of market reversals. It works best when it follows a strong and sustained uptrend, and when it is confirmed by subsequent bearish candles or supported by other technical indicators.
In fast-moving or highly volatile markets, false signals are common, which is why traders should always treat the hanging man as one piece of a bigger puzzle rather than a standalone signal.
Share Now
Disclaimer:This content is provided for informational purposes only and does not constitute, and should not be construed as, financial, investment, or other professional advice. No statement or opinion contained herein should be considered a recommendation by Ultima Markets or the author regarding any specific investment product, strategy, or transaction. Readers are advised not to rely solely on this material when making investment decisions and should seek independent advice where appropriate.
Thank you for visiting the Ultima Markets website. Please note that this website is intended for individuals residing in jurisdictions where access is permitted by law. Ultima and its affiliated entities do not operate in your home jurisdiction.
By clicking ‘Acknowledge’, you confirm that you are entering this website solely on your own initiative and not as a result of any specific marketing outreach. You wish to obtain information from this website based on reverse solicitation principles, in accordance with the applicable laws of your home jurisdiction.