This website is managed by Ultima Markets’ international entities, and it’s important to emphasise that they are not subject to regulation by the FCA in the UK. Therefore, you must understand that you will not have the FCA’s protection when investing through this website – for example:
You will not be guaranteed Negative Balance Protection
You will not be protected by FCA’s leverage restrictions
You will not have the right to settle disputes via the Financial Ombudsman Service (FOS)
You will not be protected by Financial Services Compensation Scheme (FSCS)
Any monies deposited will not be afforded the protection required under the FCA Client Assets Sourcebook. The level of protection for your funds will be determined by the regulations of the relevant local regulator.
Note: UK clients are kindly invited to visit https://www.ultima-markets.co.uk/. Ultima Markets UK expects to begin onboarding UK clients in accordance with FCA regulatory requirements in 2026.
If you would like to proceed and visit this website, you acknowledge and confirm the following:
1.The website is owned by Ultima Markets’ international entities and not by Ultima Markets UK Ltd, which is regulated by the FCA.
2.Ultima Markets Limited, or any of the Ultima Markets international entities, are neither based in the UK nor licensed by the FCA.
3.You are accessing the website at your own initiative and have not been solicited by Ultima Markets Limited in any way.
4.Investing through this website does not grant you the protections provided by the FCA.
5.Should you choose to invest through this website or with any of the international Ultima Markets entities, you will be subject to the rules and regulations of the relevant international regulatory authorities, not the FCA.
Ultima Markets wants to make it clear that we are duly licensed and authorised to offer the services and financial derivative products listed on our website. Individuals accessing this website and registering a trading account do so entirely of their own volition and without prior solicitation.
By confirming your decision to proceed with entering the website, you hereby affirm that this decision was solely initiated by you, and no solicitation has been made by any Ultima Markets entity.
This Website is intended solely for individuals located in jurisdictions where access to its content is permitted under applicable laws and regulations.
Ultima Market is not established in, and does not operate from, Singapore. Ultima Market does not offer, provide or solicit its products or services to citizens or residents of Singapore and does not accept account applications from such persons.
If you are a citizen or resident of Singapore, you must not apply to open an account or attempt to access or use any products or services offered by Ultima Market.
By clicking “Acknowledge and Enter the Website”, you confirm that you are accessing this Website entirely on your own initiative and not as a result of any direct solicitation, targeted marketing, advertising or promotional activity by Ultima Market.
Access to this Website does not constitute an offer, invitation or solicitation by Ultima Market to provide any product or service in any jurisdiction where such offer, invitation or solicitation would be unlawful.
You are responsible for ensuring that your access to this Website is permitted under the laws and regulations applicable to you .
Master the round bottom pattern with this guide. Learn about its meaning, the formation, its breakout confirmation, trading approach, and common mistakes.
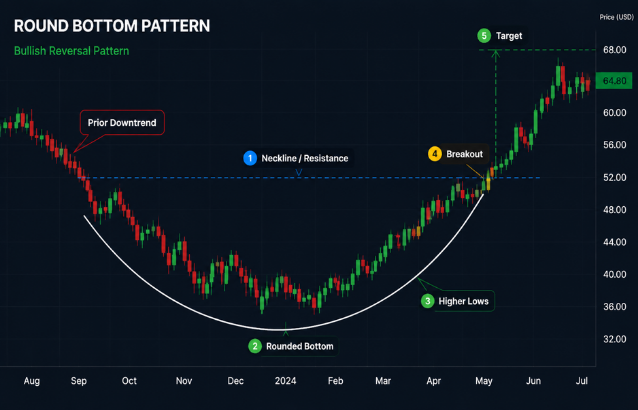
The round bottom pattern is a bullish chart formation that signals a possible shift from a prolonged downtrend to a new upward trend. Also known as a rounding bottom pattern or saucer bottom, it develops gradually as selling pressure weakens and buyers slowly regain control of the market.
Unlike a sharp V-shaped recovery, the round bottom pattern forms through a smoother transition, creating a broad U-shaped structure on the chart. Traders often use this pattern to identify potential trend reversals, although confirmation through a breakout above resistance is important before considering it a valid setup.
In this article, we will explain how the round bottom pattern forms, how traders identify it, possible trading strategies, and the key risks to consider before using it in technical analysis.
What Is a Round Bottom Pattern?
A round bottom pattern is a technical analysis formation that usually appears after an extended period of declining prices. It represents a gradual change in market sentiment, where sellers begin losing momentum and buyers gradually return.
The pattern typically consists of three stages:
Declining phase The asset remains in a downtrend as sellers dominate the market. However, the pace of the decline starts to slow as buying interest increases.
Bottoming phase Price movement becomes more stable and forms a rounded base. During this stage, neither buyers nor sellers have clear control, creating a period of consolidation.
Recovery phase Buyers gradually take control, pushing prices higher towards the previous resistance area where the decline originally started.
The pattern is considered complete when the price breaks above this resistance level, often called the neckline.
Although the round bottom pattern is commonly viewed as a reversal signal, similar rounded formations can also appear during an existing uptrend and act as continuation patterns. Therefore, traders should always consider the broader market trend before interpreting the formation.
How Does a Round Bottom Pattern Form?
The formation of a round bottom reflects a gradual balance shift between supply and demand.
At the beginning, the market is controlled by sellers, resulting in lower prices. However, as prices decline, selling pressure begins to weaken because fewer traders are willing to sell at lower levels.
During the middle stage of the formation, the market enters a consolidation period. The price stops making significant new lows, suggesting that sellers are losing strength. This creates the curved bottom of the pattern.
As confidence improves, buyers gradually increase their activity. The right side of the pattern develops as the price forms higher lows and moves towards previous resistance.
A key point is that the pattern does not need to form a perfect U shape. Real market conditions often create uneven movements, temporary rallies or a flatter bottom. The important factors are the slowdown in selling pressure, stabilisation and a confirmed recovery.
How to Identify a Valid Round Bottom Pattern
Not every U-shaped movement represents a genuine round bottom pattern. Traders should look for several characteristics before considering the setup.
Feature
What traders look for
Previous trend
A clear decline or prolonged period of weakness
Shape
A gradual U-shaped recovery rather than a sudden reversal
Bottom area
A consolidation zone where selling pressure weakens
Recovery
Higher lows forming on the right side
Resistance
A previous price level where sellers were active
Confirmation
A breakout above resistance with stronger momentum
Volume can provide additional confirmation. In traditional markets such as stocks, volume often decreases as the price approaches the bottom and increases during the recovery phase. Stronger volume during a breakout may suggest stronger participation from buyers.
However, volume interpretation depends on the market. For example, forex and many CFD markets do not provide centralised trading volume, meaning traders may rely more on price action, momentum indicators and breakout strength.
How to Trade the Round Bottom Pattern
There are several approaches traders may use when trading a round bottom pattern.
1. Wait for a breakout above resistance
The most common approach is to wait until the price closes above the resistance level that forms the top of the pattern.
Entering before the breakout may provide an earlier entry, but it also carries a higher risk because the pattern could fail and continue lower.
2. Consider a retest entry
After a breakout, the price may return to test the previous resistance level. If this area holds as new support, some traders view it as a potential entry opportunity.
Historical research by Thomas Bulkowski found that throwbacks after breakouts occurred frequently in his study of rounding bottoms, meaning a return towards the breakout area is not unusual. However, a retest is not guaranteed, and some breakouts continue higher without returning.
3. Set a risk management level
Possible stop-loss locations include:
Below the breakout level after a successful retest
Below the most recent higher low on the right side of the pattern
Below the lowest point of the entire formation
The appropriate level depends on the trader’s strategy and risk tolerance. A wider stop provides more room for price movement but also increases potential risk.
4. Estimate a potential price target
A common method is to measure the height of the pattern and project it upwards from the breakout point.
For example:
Lowest point of pattern: $50
Resistance level: $70
Pattern depth: $20
Breakout point: $70
Potential target: $90
This is only a reference estimate. Market conditions, volatility and nearby resistance levels may affect whether the price reaches the projected target.
Round Bottom Pattern vs Similar Chart Patterns
Several technical patterns can look similar to a round bottom pattern, but there are important differences.
Pattern
Main difference
Round bottom
A broad U-shaped recovery after weakness
Cup and handle
A rounded base followed by a smaller pullback or consolidation
Double bottom
A W-shaped pattern with two clear lows
V-shaped reversal
A rapid decline followed by an equally sharp recovery
The main difference between a round bottom and a cup and handle is the handle. A cup and handle pattern includes a smaller consolidation period after the rounded recovery, while a round bottom usually moves directly towards the breakout area.
Strengths and Limitations
The main advantage of the round bottom pattern is that it helps traders identify gradual changes in market sentiment. Instead of relying on a single sharp reversal signal, the pattern shows a longer transition from selling pressure to buying interest.
However, the formation also has limitations.
First, it can take weeks, months or even years to develop, making it less suitable for traders looking for short-term signals.
Second, identifying the pattern can be subjective. Different traders may draw different resistance levels or define the start and end of the formation differently.
Third, false breakouts can occur. A price move above resistance does not always lead to a sustained rally, especially if market conditions remain weak.
For this reason, traders often combine the round bottom pattern with other forms of analysis, such as trend analysis, momentum indicators and risk management strategies.
Conclusion
The round bottom pattern is a useful technical formation for identifying gradual shifts in market direction. Its rounded structure reflects weakening selling pressure and growing buying interest, making it a popular pattern among traders looking for potential bullish reversals.
However, traders should avoid treating every U-shaped chart as a confirmed setup. The most important signal is a successful breakout above resistance, supported by proper risk management and wider market analysis.
By understanding how the rounding bottom develops, how to confirm the breakout and where the pattern can fail, traders can use this formation as part of a more disciplined technical analysis approach.
FAQs
Is a round bottom pattern bullish?
Yes. The round bottom pattern is generally considered a bullish formation because it often signals a transition from a downtrend to an uptrend.
What confirms a round bottom breakout?
A breakout above the resistance level or neckline confirms the pattern. Stronger momentum and volume can provide additional support.
Is a round bottom pattern the same as a cup and handle?
No. A cup and handle pattern includes an additional pullback or consolidation phase after the rounded base.
Share Now
Disclaimer:This content is provided for informational purposes only and does not constitute, and should not be construed as, financial, investment, or other professional advice. No statement or opinion contained herein should be considered a recommendation by Ultima Markets or the author regarding any specific investment product, strategy, or transaction. Readers are advised not to rely solely on this material when making investment decisions and should seek independent advice where appropriate.
Thank you for visiting the Ultima Markets website. Please note that this website is intended for individuals residing in jurisdictions where access is permitted by law. Ultima and its affiliated entities do not operate in your home jurisdiction.
By clicking ‘Acknowledge’, you confirm that you are entering this website solely on your own initiative and not as a result of any specific marketing outreach. You wish to obtain information from this website based on reverse solicitation principles, in accordance with the applicable laws of your home jurisdiction.