This website is managed by Ultima Markets’ international entities, and it’s important to emphasise that they are not subject to regulation by the FCA in the UK. Therefore, you must understand that you will not have the FCA’s protection when investing through this website – for example:
You will not be guaranteed Negative Balance Protection
You will not be protected by FCA’s leverage restrictions
You will not have the right to settle disputes via the Financial Ombudsman Service (FOS)
You will not be protected by Financial Services Compensation Scheme (FSCS)
Any monies deposited will not be afforded the protection required under the FCA Client Assets Sourcebook. The level of protection for your funds will be determined by the regulations of the relevant local regulator.
Note: UK clients are kindly invited to visit https://www.ultima-markets.co.uk/. Ultima Markets UK expects to begin onboarding UK clients in accordance with FCA regulatory requirements in 2026.
If you would like to proceed and visit this website, you acknowledge and confirm the following:
1.The website is owned by Ultima Markets’ international entities and not by Ultima Markets UK Ltd, which is regulated by the FCA.
2.Ultima Markets Limited, or any of the Ultima Markets international entities, are neither based in the UK nor licensed by the FCA.
3.You are accessing the website at your own initiative and have not been solicited by Ultima Markets Limited in any way.
4.Investing through this website does not grant you the protections provided by the FCA.
5.Should you choose to invest through this website or with any of the international Ultima Markets entities, you will be subject to the rules and regulations of the relevant international regulatory authorities, not the FCA.
Ultima Markets wants to make it clear that we are duly licensed and authorised to offer the services and financial derivative products listed on our website. Individuals accessing this website and registering a trading account do so entirely of their own volition and without prior solicitation.
By confirming your decision to proceed with entering the website, you hereby affirm that this decision was solely initiated by you, and no solicitation has been made by any Ultima Markets entity.
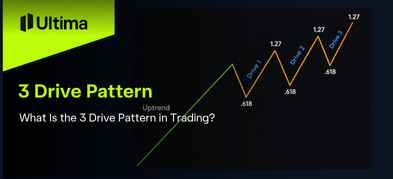
Learn what the Three Drive Pattern is. Learn how to identify its bullish and bearish setups. See how traders use this reversal pattern to spot potential.
The three drive pattern is a harmonic trading pattern that traders use to identify potential market reversal areas. It forms when price makes three consecutive movements in the same direction, with each drive following a similar structure and often reaching key Fibonacci extension levels.
Also known as the 3 drive pattern, this technical setup focuses on price symmetry, Fibonacci ratios and market exhaustion. While the pattern can highlight areas where a trend may be losing strength, it does not guarantee a reversal. ‘
Traders usually combine it with other technical tools, such as momentum indicators and support or resistance levels, before making trading decisions.
What Is the Three Drive Pattern?
The three drive pattern is a reversal formation based on the idea that strong trends can eventually lose momentum after repeated extensions. Instead of changing direction immediately, the market often makes one final push before buyers or sellers become exhausted.
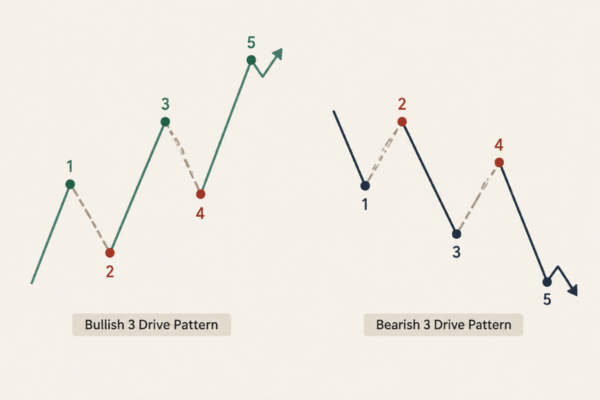
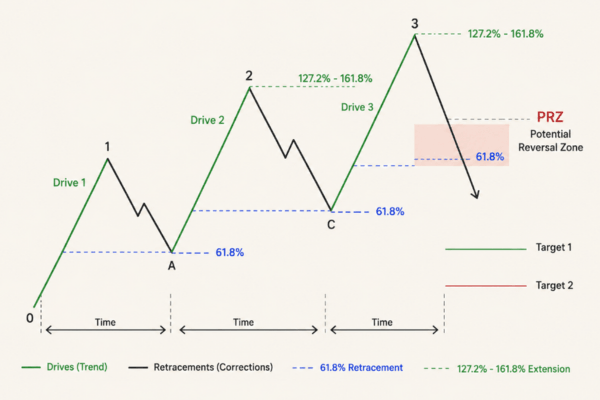
The pattern consists of three extended price movements, known as drives, with two corrective retracements between them. A complete formation contains five key points:
Drive 1 creates the initial price movement
Retracement A marks the first correction
Drive 2 extends the trend further
Retracement C creates another pullback
Drive 3 completes the final extension and reaches a potential reversal area
The pattern can appear in two forms:
Bullish three drive pattern: Forms after three downward moves and suggests selling pressure may be weakening.
Bearish three drive pattern: Forms after three upward moves and suggests buying momentum may be fading.
The key concept behind the pattern is exhaustion. Each drive pushes price further, but momentum may gradually decrease as the formation develops.
How Does the 3 Drive Pattern Work?
The 3 drive pattern works by identifying repeated price extensions that show symmetry between each movement.
In a bearish setup, price moves higher three times. The first two advances may continue attracting buyers, but by the third drive, the market may be approaching an area where buying pressure is limited. If confirmation appears, price may begin a downward correction.
In a bullish setup, the market declines three times. The third drive may represent a final selling wave before buyers return and attempt to push price higher.
However, not every three-move price movement creates a valid pattern. A stronger setup usually shows:
Similar distance between each drive
Similar timing between movements
Clear Fibonacci alignment
Confirmation from other technical indicators
This combination of price and time symmetry is what separates the three drive pattern from ordinary market swings.
Fibonacci Rules and Potential Reversal Zone
Fibonacci measurements are one of the most important parts of identifying a valid three drive pattern.
Common Fibonacci relationships include:
Retracements around the 61.8% or 78.6% Fibonacci levels
Drive extensions reaching around the 127.2% or 161.8% Fibonacci extension levels
The completion of the third drive creates what harmonic traders call the Potential Reversal Zone (PRZ). This is the area where traders monitor whether the market may begin changing direction.
The PRZ is not an automatic entry point. Instead, traders often wait for additional confirmation, such as:
A reversal candlestick pattern
RSI divergence
A rejection from support or resistance
Changes in trading volume
For example, if price reaches the third drive high but RSI forms a lower high, it may indicate that upward momentum is weakening.
Why Time Symmetry Matters
Many traders focus only on price levels, but the three drive pattern also considers the timing of each movement.
A formation is generally considered stronger when each drive develops over a similar period. For example, if the first and second drives take ten trading sessions to complete, but the third drive develops within one session, the pattern may have weaker symmetry.
Time symmetry helps traders distinguish a structured harmonic setup from random price movements.
How Traders Use the Three Drive Pattern
Traders typically use the pattern as a framework for identifying possible reversal opportunities rather than as a standalone trading signal.
1. Wait for Confirmation
After the third drive reaches the potential reversal zone, traders usually wait for evidence that the trend is weakening.
Common confirmation methods include:
RSI or MACD divergence
Candlestick reversal signals
Moving average reactions
Breaks of short-term trendlines
This approach helps reduce the risk of entering against a strong trend.
2. Plan Entry and Risk Levels
A common approach is to consider an entry after confirmation appears near the PRZ. Stop-loss levels are often placed beyond the third drive extreme because a move beyond this point may invalidate the pattern.
Profit targets may be based on previous retracement levels, support and resistance zones, or other technical structures.
Like all trading methods, proper risk management remains essential because the pattern can fail during strong market trends or periods of high volatility.
Three Drive Pattern vs Other Chart Patterns
The three drive pattern is sometimes confused with other reversal formations, but there are important differences.
Three Drive Pattern vs ABCD Pattern
The ABCD pattern consists of two major price movements and a correction, creating four key points. The three drive pattern includes an additional extension, creating three separate drives before a possible reversal.
Because of this extra movement, the three drive pattern usually requires stronger symmetry and Fibonacci alignment.
Three Drive Pattern vs Three Push Pattern
The three push pattern focuses mainly on three failed attempts to continue a trend. It does not always require Fibonacci measurements.
The three drive pattern is more structured because it relies on specific Fibonacci relationships and price symmetry.
Three Drive Pattern vs Wedge Pattern
A wedge pattern is identified through converging trendlines, while the three drive pattern is based on repeated price extensions and Fibonacci calculations.
Understanding these differences can help traders avoid confusing separate market formations.
Can Trading Tools Detect the Three Drive Pattern?
Modern charting platforms now offer automated tools that can help traders identify possible three drive formations by scanning price movements and applying Fibonacci measurements.
These tools can save time by highlighting potential setups, but they should not replace analysis. Automated detection cannot fully assess market conditions, liquidity or whether a reversal has enough momentum to develop.
The quality of a setup still depends on confirmation and broader market context.
Advantages and Limitations
Advantages
Helps identify potential exhaustion points
Uses structured Fibonacci measurements
Can be applied across forex, stocks, commodities and indices
Provides clear areas for planning trades
Limitations
Can be difficult to identify in real time
Requires accurate Fibonacci measurement
May fail during strong trends
Should not be used without confirmation
Conclusion
The three drive pattern is a useful harmonic trading formation that helps traders identify possible reversal zones through Fibonacci analysis, price symmetry and market structure.
The 3 drive pattern does not predict every market turning point, but it provides a framework for analysing situations where a trend may be losing momentum. By combining the pattern with confirmation signals and proper risk management, traders can use it as part of a broader technical analysis approach.
FAQs
What is a three drive pattern in trading?
A three drive pattern is a harmonic reversal formation where price makes three consecutive movements in the same direction before potentially changing trend.
Is the 3 drive pattern bullish or bearish?
The 3 drive pattern can be bullish or bearish depending on whether it forms after a downtrend or an uptrend.
Is the three drive pattern reliable?
The pattern can help identify possible reversal areas, but traders usually combine it with other indicators because false signals can occur.
What indicators work with the three drive pattern?
Traders commonly use RSI divergence, candlestick signals, volume analysis and support or resistance levels to confirm the setup.
Share Now
Disclaimer:This content is provided for informational purposes only and does not constitute, and should not be construed as, financial, investment, or other professional advice. No statement or opinion contained herein should be considered a recommendation by Ultima Markets or the author regarding any specific investment product, strategy, or transaction. Readers are advised not to rely solely on this material when making investment decisions and should seek independent advice where appropriate.
Thank you for visiting the Ultima Markets website. Please note that this website is intended for individuals residing in jurisdictions where access is permitted by law. Ultima and its affiliated entities do not operate in your home jurisdiction.
By clicking ‘Acknowledge’, you confirm that you are entering this website solely on your own initiative and not as a result of any specific marketing outreach. You wish to obtain information from this website based on reverse solicitation principles, in accordance with the applicable laws of your home jurisdiction.