This website is managed by Ultima Markets’ international entities, and it’s important to emphasise that they are not subject to regulation by the FCA in the UK. Therefore, you must understand that you will not have the FCA’s protection when investing through this website – for example:
You will not be guaranteed Negative Balance Protection
You will not be protected by FCA’s leverage restrictions
You will not have the right to settle disputes via the Financial Ombudsman Service (FOS)
You will not be protected by Financial Services Compensation Scheme (FSCS)
Any monies deposited will not be afforded the protection required under the FCA Client Assets Sourcebook. The level of protection for your funds will be determined by the regulations of the relevant local regulator.
Note: UK clients are kindly invited to visit https://www.ultima-markets.co.uk/. Ultima Markets UK expects to begin onboarding UK clients in accordance with FCA regulatory requirements in 2026.
If you would like to proceed and visit this website, you acknowledge and confirm the following:
1.The website is owned by Ultima Markets’ international entities and not by Ultima Markets UK Ltd, which is regulated by the FCA.
2.Ultima Markets Limited, or any of the Ultima Markets international entities, are neither based in the UK nor licensed by the FCA.
3.You are accessing the website at your own initiative and have not been solicited by Ultima Markets Limited in any way.
4.Investing through this website does not grant you the protections provided by the FCA.
5.Should you choose to invest through this website or with any of the international Ultima Markets entities, you will be subject to the rules and regulations of the relevant international regulatory authorities, not the FCA.
Ultima Markets wants to make it clear that we are duly licensed and authorised to offer the services and financial derivative products listed on our website. Individuals accessing this website and registering a trading account do so entirely of their own volition and without prior solicitation.
By confirming your decision to proceed with entering the website, you hereby affirm that this decision was solely initiated by you, and no solicitation has been made by any Ultima Markets entity.
Discover how the Gordon Growth Model works. Learn its formula, example, key assumptions, limitations, and how investors use it to value dividend stocks.
The Gordon Growth Model is a stock valuation method used to estimate the intrinsic value of a dividend-paying company. It values a stock based on three inputs: next year’s expected dividend, the required rate of return, and the expected long-term dividend growth rate.
Also known as the constant growth dividend discount model, the Gordon Growth Model is built on a simple idea. A stock is worth the present value of the cash flows investors expect to receive in the future. For dividend investors, those cash flows are dividends.
Who Uses this Model?
This model is most useful for mature companies with stable earnings, consistent dividends, and predictable long-term growth. It is often used to analyse blue-chip stocks, utilities, consumer staples companies, banks, and other businesses with established dividend policies.
The formula is simple, but the assumptions are powerful. A small change in the growth rate or required return can significantly change the estimated fair value. That is why investors should treat the Gordon Growth Model as a valuation guide, not as a final answer.
Gordon Growth Model Formula
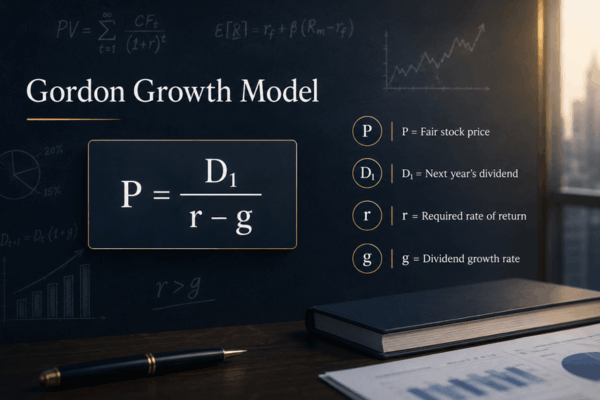
The Gordon Growth Model formula is:
P = D₁ / (r – g)
Where:
Input
Meaning
P
Estimated intrinsic value of the stock
D₁
Expected dividend per share next year
r
Required rate of return
g
Constant dividend growth rate
For example, if a company is expected to pay a dividend of $3.00 next year, the required return is 8%, and dividends are expected to grow by 4% per year, the calculation would be:
P = 3.00 / (0.08 – 0.04) P = 3.00 / 0.04 P = $75
Based on the model, the estimated fair value of the stock is $75 per share. If the current market price is below $75, the stock may appear undervalued. If it is above $75, it may appear overvalued.
Understanding the Key Inputs
Expected dividend next year
The model uses next year’s expected dividend, not the dividend already paid this year. If the company recently paid a dividend of $2.00 and dividends are expected to grow by 5%, next year’s expected dividend would be:
D₁ = 2.00 × 1.05 = $2.10
Using the correct dividend figure matters because the model values future cash flows, not past payments.
Required rate of return
The required rate of return is the minimum return an investor expects for taking on the risk of owning the stock. It may reflect interest rates, inflation expectations, market risk, company risk, and the return available from other investments.
When government bond yields are higher, investors may demand a higher return from equities. This can reduce the fair value estimate because the denominator in the formula becomes larger.
Dividend growth rate
The dividend growth rate is the expected long-term rate at which dividends will grow. This input should be realistic and sustainable. A company may grow dividends quickly for a few years, but the Gordon Growth Model assumes that growth continues forever.
As a rule, the long-term growth rate should usually be close to or below the long-term nominal growth rate of the economy. If the growth assumption is too optimistic, the valuation can become inflated.
Gordon Growth Model Example
Imagine a stable dividend-paying company with the following assumptions:
Item
Assumption
Expected dividend next year
$4.00
Required rate of return
9%
Dividend growth rate
3%
Using the formula:
P = D₁ / (r – g) P = 4.00 / (0.09 – 0.03) P = 4.00 / 0.06 P = $66.67
The estimated intrinsic value is $66.67 per share.
If the stock is trading at $55, an investor may consider it undervalued based on these assumptions. If it is trading at $80, the stock may look expensive. However, the conclusion depends heavily on whether the dividend growth rate and required return are reasonable.
This is why investors often calculate several scenarios instead of relying on one fixed number.
Why Sensitivity Analysis Matters
The Gordon Growth Model is highly sensitive to small changes in its inputs. This is especially true when the required return and growth rate are close together.
Using an expected dividend of $3.00, the estimated value changes sharply under different assumptions:
Dividend growth rate
r = 7%
r = 8%
r = 9%
r = 10%
g = 2%
$60.00
$50.00
$42.86
$37.50
g = 3%
$75.00
$60.00
$50.00
$42.86
g = 4%
$100.00
$75.00
$60.00
$50.00
g = 5%
$150.00
$100.00
$75.00
$60.00
This table shows why the model should be used carefully. With the same expected dividend, the valuation can range from $37.50 to $150 depending on the assumptions.
A practical approach is to create three cases:
Conservative case with lower dividend growth and a higher required return
Base case with realistic assumptions
Optimistic case with stronger growth and a lower required return
This gives investors a valuation range instead of one single target price.
When to Use the Gordon Growth Model
The Gordon Growth Model works best when a company has a stable dividend record and predictable long-term growth. It is more suitable for mature businesses than for fast-growing companies.
It may be useful for:
Dividend-paying blue-chip companies
Utility stocks
Consumer staples businesses
Banks and insurers with steady payouts
Broad equity indexes with stable long-term assumptions
The model can also be used in discounted cash flow analysis to estimate terminal value. In a DCF model, analysts forecast cash flows for a fixed period and then estimate the value of cash flows beyond that forecast period. The same logic is used in the perpetuity growth method.
In that case, the terminal value formula is often:
Terminal Value = FCFₙ₊₁ / (WACC – g)
The idea is similar. A stable future cash flow is assumed to grow at a constant rate and is discounted back to today.
Limitations of the Gordon Growth Model
The biggest limitation of the Gordon Growth Model is that it assumes dividends grow at a constant rate forever. In real life, companies may increase, reduce, suspend, or cancel dividends depending on business conditions.
It is also unsuitable for companies that do not pay dividends. Many growth companies reinvest profits instead of paying shareholders directly, so other valuation methods may be more appropriate.
Another issue is that the model does not fully capture share buybacks. Many modern companies return capital through buybacks as well as dividends. If a company relies heavily on buybacks, the Gordon Growth Model may understate total shareholder returns.
Investors should also avoid these common mistakes:
Using the current dividend instead of next year’s expected dividend
Assuming an unrealistically high perpetual growth rate
Applying the model to unstable or cyclical companies
Ignoring dividend safety and free cash flow support
Using a required return that is too close to the growth rate
The formula only works properly when the required return is higher than the growth rate. If the growth rate is equal to or higher than the required return, the result becomes unrealistic.
Conclusion
The Gordon Growth Model is a simple but useful valuation tool for dividend-paying stocks. It helps investors estimate fair value by using expected dividends, required return, and long-term dividend growth.
Its main strength is clarity. It shows how much a stock’s value depends on future cash flows and long-term assumptions.
However, its simplicity is also its weakness. The model works best for stable companies, but it can be misleading when dividend growth is uncertain, payout policies change, or assumptions are too optimistic.
For investors, the Gordon Growth Model is best used as a starting point. It should be combined with sensitivity analysis, dividend safety checks, business fundamentals, and other valuation methods before making an investment decision.
FAQs
What is the Gordon Growth Model?
The Gordon Growth Model is a valuation formula used to estimate the intrinsic value of a dividend-paying stock based on expected dividends and constant growth.
Is the Gordon Growth Model the same as the Dividend Discount Model?
It is a type of Dividend Discount Model. It is the constant growth version because it assumes dividends grow at the same rate forever.
What is the main weakness of the Gordon Growth Model?
Its main weakness is that it assumes constant dividend growth forever, which may not reflect real business conditions.
Share Now
Disclaimer:This content is provided for informational purposes only and does not constitute, and should not be construed as, financial, investment, or other professional advice. No statement or opinion contained herein should be considered a recommendation by Ultima Markets or the author regarding any specific investment product, strategy, or transaction. Readers are advised not to rely solely on this material when making investment decisions and should seek independent advice where appropriate.
Thank you for visiting the Ultima Markets website. Please note that this website is intended for individuals residing in jurisdictions where access is permitted by law. Ultima and its affiliated entities do not operate in your home jurisdiction.
By clicking ‘Acknowledge’, you confirm that you are entering this website solely on your own initiative and not as a result of any specific marketing outreach. You wish to obtain information from this website based on reverse solicitation principles, in accordance with the applicable laws of your home jurisdiction.