This website is managed by Ultima Markets’ international entities, and it’s important to emphasise that they are not subject to regulation by the FCA in the UK. Therefore, you must understand that you will not have the FCA’s protection when investing through this website – for example:
You will not be guaranteed Negative Balance Protection
You will not be protected by FCA’s leverage restrictions
You will not have the right to settle disputes via the Financial Ombudsman Service (FOS)
You will not be protected by Financial Services Compensation Scheme (FSCS)
Any monies deposited will not be afforded the protection required under the FCA Client Assets Sourcebook. The level of protection for your funds will be determined by the regulations of the relevant local regulator.
Note: UK clients are kindly invited to visit https://www.ultima-markets.co.uk/. Ultima Markets UK expects to begin onboarding UK clients in accordance with FCA regulatory requirements in 2026.
If you would like to proceed and visit this website, you acknowledge and confirm the following:
1.The website is owned by Ultima Markets’ international entities and not by Ultima Markets UK Ltd, which is regulated by the FCA.
2.Ultima Markets Limited, or any of the Ultima Markets international entities, are neither based in the UK nor licensed by the FCA.
3.You are accessing the website at your own initiative and have not been solicited by Ultima Markets Limited in any way.
4.Investing through this website does not grant you the protections provided by the FCA.
5.Should you choose to invest through this website or with any of the international Ultima Markets entities, you will be subject to the rules and regulations of the relevant international regulatory authorities, not the FCA.
Ultima Markets wants to make it clear that we are duly licensed and authorised to offer the services and financial derivative products listed on our website. Individuals accessing this website and registering a trading account do so entirely of their own volition and without prior solicitation.
By confirming your decision to proceed with entering the website, you hereby affirm that this decision was solely initiated by you, and no solicitation has been made by any Ultima Markets entity.
Compare CCI vs RSI in trading. Learn how each indicator works. See when to use them, the best settings, signal differences and common mistakes to avoid.
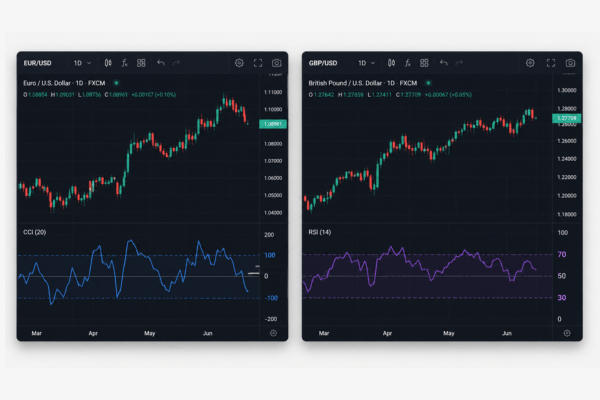
When comparing CCI vs RSI, traders are usually trying to decide which momentum indicator gives clearer signals. Both tools can help you spot overbought and oversold conditions, momentum shifts, divergence and possible trend changes. However, they do not measure the market in the same way.
RSI is often easier for beginners because it moves between 0 and 100. CCI is more flexible because it is unbounded and measures how far price has moved away from its average. The better choice depends on your strategy, timeframe and whether the market is trending, ranging or volatile.
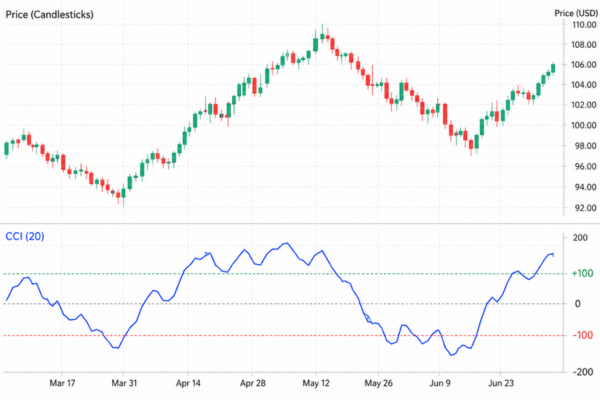
What Is CCI?
CCI stands for Commodity Channel Index. Although it was first designed for commodity markets, traders now use it for stocks, forex, indices, crypto and other assets.
CCI compares the current typical price with its average over a selected period. Typical price is based on the high, low and close. In simple terms, CCI shows whether price is trading far above or far below its recent average.
Common CCI levels are:
CCI Reading
Meaning
Above +100
Strong bullish momentum or price stretched above average
Around 0
Price is close to its average
Below -100
Strong bearish momentum or price stretched below average
A key point is that CCI is not limited to a fixed range. It can move above +200 or below -200 during strong or volatile markets. This makes it useful for spotting momentum expansion, but it also means signals need context.
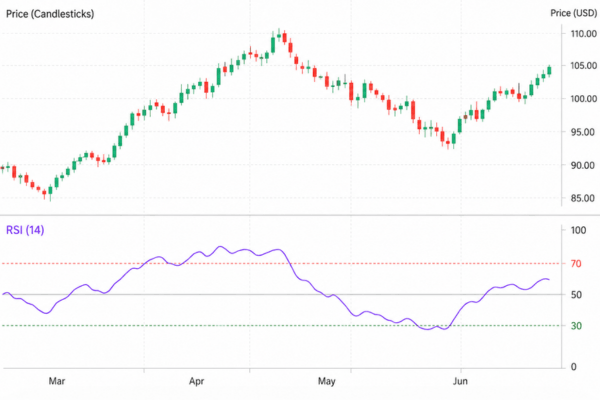
What Is RSI?
RSI stands for Relative Strength Index. It measures the strength of recent price gains compared with recent price losses. RSI is commonly shown with a 14-period setting.
Unlike CCI, RSI is bounded. It always moves between 0 and 100, which makes it easier to read at a glance.
Common RSI levels are:
RSI Reading
Meaning
Above 70
Potentially overbought
Around 50
Neutral momentum
Below 30
Potentially oversold
However, RSI should not be used as a simple buy or sell button. In a strong uptrend, RSI can stay above 70 for longer than expected. In a strong downtrend, it can stay below 30 while price keeps falling.
CCI vs RSI: The Main Difference
The main difference in CCI vs RSI is what each indicator measures. CCI measures price deviation from an average, while RSI measures the balance between recent buying pressure and selling pressure.
This means CCI often reacts strongly when price moves sharply away from its average. It may give earlier momentum signals, especially during breakouts or fast trend changes. RSI is usually smoother and easier to interpret because it stays within a fixed range.
For example, CCI may move above +100 when price breaks strongly above its average. That does not always mean the asset is overbought and ready to fall. It may show that a new bullish move is building. RSI may also rise during the same move, but it might not reach 70 immediately.
This is why the CCI vs RSI comparison is not about finding one perfect indicator. It is about knowing which one gives the type of information you need.
CCI vs RSI by Market Condition
Different markets favour different tools. Here is a simple way to compare them:
Market Condition
Indicator to Prioritise
Why
Sideways market
RSI
Overbought and oversold levels can work well when price moves in a range.
Strong trend
CCI or RSI trend ranges
CCI can show momentum expansion, while RSI can confirm trend strength.
Volatile market
CCI with wider levels
CCI can adapt better because it is unbounded.
Beginner analysis
RSI
RSI is simpler because it stays between 0 and 100.
Breakout trading
CCI
CCI can show when price moves unusually far from its average.
In an uptrend, RSI often stays in a higher range instead of falling back to 30. Traders may watch the 40 to 50 area as potential support. In a downtrend, RSI may struggle around the 50 to 60 area, which can act as resistance. This makes RSI more useful when you read it with the trend rather than against it.
Best Settings for CCI and RSI
The standard RSI setting is 14 periods. Shorter settings, such as 7 or 9 periods, make RSI more sensitive. Longer settings, such as 21 periods, make it smoother but slower.
CCI is often used with a 20-period setting. A shorter CCI setting gives faster signals, while a longer setting gives fewer but smoother signals.
The level settings can also be adjusted. For RSI, many traders start with 70 and 30. In stronger or more volatile markets, some use 80 and 20 to reduce false reversal signals. For CCI, traders often start with +100 and -100, but may use +200 and -200 when an asset regularly moves beyond the standard levels.
The best setting is not universal. It should match your market, timeframe and risk tolerance.
Can You Use CCI and RSI Together?
Yes, you can use CCI and RSI together, but they should not be treated as two guaranteed confirmations. Both are momentum indicators, so they can sometimes repeat similar information.
A better approach is to give each indicator a different role. For example, you might use CCI to spot momentum expansion and RSI to confirm whether buying or selling pressure is improving. If CCI moves above +100 and RSI is also rising above 50, bullish momentum may be strengthening. If CCI drops below -100 and RSI stays below 50, bearish pressure may be stronger.
Still, price action should come first. Support and resistance, trend direction, candlestick behaviour and volume can all help filter weak signals.
Common Mistakes to Avoid
The biggest mistake is assuming that overbought always means sell and oversold always means buy. This can be dangerous in trending markets.
A CCI reading above +100 can mean price is stretched, but it can also mean bullish momentum is increasing. An RSI reading above 70 can warn that price is extended, but it can also happen early in a powerful uptrend.
Another mistake is using the same settings on every asset. A slow-moving stock may not behave like a volatile crypto pair. Traders should review how each indicator behaves on the asset they are trading.
Finally, avoid using indicators without risk management. CCI and RSI can help with analysis, but neither can predict the market with certainty.
Is CCI or RSI Better?
There is no single winner in the CCI vs RSI debate. RSI is better for traders who want a simple, clear and beginner-friendly momentum indicator. CCI is better for traders who want to measure how far price has moved from its average and identify momentum expansion earlier.
For most beginners, RSI is the easier starting point. For traders who understand volatility and trend behaviour, CCI can add useful detail. The strongest approach is to use either indicator with price action, trend analysis and sensible risk management.
FAQs
Is CCI better than RSI?
Not always. CCI may react faster, while RSI is easier to read.
Can CCI and RSI be used together?
Yes. Use one for the main signal and the other for confirmation.
Is CCI good for beginners?
It can be, but RSI is usually easier to learn first.
Share Now
Disclaimer:This content is provided for informational purposes only and does not constitute, and should not be construed as, financial, investment, or other professional advice. No statement or opinion contained herein should be considered a recommendation by Ultima Markets or the author regarding any specific investment product, strategy, or transaction. Readers are advised not to rely solely on this material when making investment decisions and should seek independent advice where appropriate.
Thank you for visiting the Ultima Markets website. Please note that this website is intended for individuals residing in jurisdictions where access is permitted by law. Ultima and its affiliated entities do not operate in your home jurisdiction.
By clicking ‘Acknowledge’, you confirm that you are entering this website solely on your own initiative and not as a result of any specific marketing outreach. You wish to obtain information from this website based on reverse solicitation principles, in accordance with the applicable laws of your home jurisdiction.