This website is managed by Ultima Markets’ international entities, and it’s important to emphasise that they are not subject to regulation by the FCA in the UK. Therefore, you must understand that you will not have the FCA’s protection when investing through this website – for example:
You will not be guaranteed Negative Balance Protection
You will not be protected by FCA’s leverage restrictions
You will not have the right to settle disputes via the Financial Ombudsman Service (FOS)
You will not be protected by Financial Services Compensation Scheme (FSCS)
Any monies deposited will not be afforded the protection required under the FCA Client Assets Sourcebook. The level of protection for your funds will be determined by the regulations of the relevant local regulator.
Note: UK clients are kindly invited to visit https://www.ultima-markets.co.uk/. Ultima Markets UK expects to begin onboarding UK clients in accordance with FCA regulatory requirements in 2026.
If you would like to proceed and visit this website, you acknowledge and confirm the following:
1.The website is owned by Ultima Markets’ international entities and not by Ultima Markets UK Ltd, which is regulated by the FCA.
2.Ultima Markets Limited, or any of the Ultima Markets international entities, are neither based in the UK nor licensed by the FCA.
3.You are accessing the website at your own initiative and have not been solicited by Ultima Markets Limited in any way.
4.Investing through this website does not grant you the protections provided by the FCA.
5.Should you choose to invest through this website or with any of the international Ultima Markets entities, you will be subject to the rules and regulations of the relevant international regulatory authorities, not the FCA.
Ultima Markets wants to make it clear that we are duly licensed and authorised to offer the services and financial derivative products listed on our website. Individuals accessing this website and registering a trading account do so entirely of their own volition and without prior solicitation.
By confirming your decision to proceed with entering the website, you hereby affirm that this decision was solely initiated by you, and no solicitation has been made by any Ultima Markets entity.
Learn how to use OHLC trading with key price points: Open, High, Low, and Close. This is essential for traders to identify trends and market conditions.
In the world of trading, having access to clear and reliable information is essential for making informed decisions. One of the most popular tools for this is the OHLC chart. OHLC trading has become a cornerstone of technical analysis, offering traders a comprehensive view of market activity.
Whether you’re in forex, stocks, or commodities, OHLC data can help you identify trends, reversals, and key price levels. In this article, we’ll explore what OHLC is, how it works, and how traders use it to their advantage.
What is OHLC?
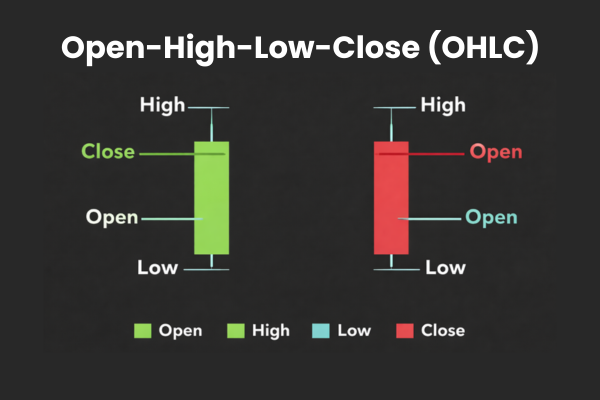
OHLC stands for Open, High, Low, and Close. These are the four key price points used in a specific time period to track price movement in trading.
Open: The price at the start of the trading period.
High: The highest price reached during the period.
Low: The lowest price reached during the period.
Close: The price at the end of the trading period.
These four data points are visualised through bar charts or candlestick charts, with each bar or candle representing a single period of trading activity.
Why OHLC is Crucial in Trading
OHLC charts provide much more information than line charts, which only show closing prices. By displaying the open, high, low, and close, OHLC charts give traders a deeper insight into the volatility and strength of the market during that period.
Key Benefits of OHLC:
Market Sentiment: Observing whether the close is higher or lower than the open helps gauge whether bulls or bears are in control.
Volatility Insights: The range between the high and low shows how much the price fluctuated, indicating market volatility.
Trend Identification: OHLC data helps traders identify if the market is moving up, down, or sideways.
Key Price Levels: The open, high, low, and close can pinpoint support and resistance levels crucial for making entry and exit decisions.
These factors make OHLC charts an essential tool for traders looking to analyse and predict price movements in various markets.
OHLC vs Candlestick vs Line Charts
There are different ways to display OHLC data, and each serves its purpose in trading. Below is a comparison of the three chart types:
Chart Type
Shows OHLC?
Best For
Why It Matters
Line
No (close only)
Trend direction
Simplest view but limited detail
OHLC Bar
Yes
Classic price action
Minimalistic and precise
Candlestick
Yes
Pattern recognition
Most popular among active traders
Candlestick charts are a more popular form of OHLC chart. They use the same data but with a more visually intuitive format, making patterns easier to spot.
How to Read OHLC Data
Reading OHLC data effectively requires understanding the relationship between the open, high, low, and close. Here’s how to interpret the information:
Bullish vs Bearish Trends
Bullish (Upward) Trends: When the price closes higher than it opens, it indicates buying pressure, typically interpreted as a bullish signal.
Bearish (Downward) Trends: Conversely, when the price closes lower than it opens, it signals selling pressure and is considered a bearish signal.
Indecision and Reversal Signals
Indecision: If the open and close are very close to each other, and the price range (high to low) is wide, it could indicate market indecision or a potential reversal. These are often referred to as “Doji” candles in candlestick charting.
By observing these characteristics over multiple periods, traders can begin to discern broader trends and market conditions.
Using OHLC in Trading Strategies
Traders use OHLC charts to develop and refine their trading strategies. Here are a few common strategies that rely on OHLC data:
1. Trend Following
A common strategy is to identify trends based on the open and close prices over multiple periods. When the close consistently exceeds the open, the market may be in an uptrend, and traders may look for buying opportunities. Conversely, if the close is below the open, it may signal a downtrend, prompting traders to consider selling or shorting.
2. Support and Resistance Levels
OHLC data helps traders identify key price levels. The highest high in an uptrend might act as resistance, while the lowest low in a downtrend could act as support. By monitoring these levels, traders can plan their entries and exits more effectively.
3. Reversal Patterns
Certain candlestick patterns, such as the Engulfing Pattern or Hammer, can signal potential reversals. A bullish engulfing pattern, for example, occurs when a smaller bearish candle is followed by a larger bullish candle, suggesting a shift from selling pressure to buying pressure.
4. Breakouts
Traders use OHLC charts to identify when an asset breaks through key resistance or support levels. For example, if the price closes above a significant resistance level, it may signal the start of an upward movement, prompting traders to go long.
Advanced Techniques: OHLC with Indicators
While OHLC data is valuable on its own, many traders combine it with other indicators to improve their analysis. Here are a few commonly used indicators that work well with OHLC charts:
Moving Averages: These smooth out price data over a set period and can help traders confirm trends. A price above a moving average could be a signal to buy, while a price below could be a signal to sell.
Relative Strength Index (RSI): This momentum oscillator helps traders identify overbought or oversold conditions, providing additional confirmation of price movements seen on the OHLC chart.
Bollinger Bands: These bands indicate volatility and can help traders spot periods of consolidation or potential breakout points based on the OHLC data.
Combining OHLC data with these indicators helps traders make more informed decisions, improving the accuracy of their trades.
Common Pitfalls to Avoid in OHLC Trading
Despite its usefulness, OHLC trading isn’t without its challenges. Here are some pitfalls to watch out for:
1. Over-Reliance on Single Candles
It’s important not to base trading decisions on just one candle or period. Always consider multiple periods to get a clearer picture of market sentiment and trend direction.
2. Ignoring Volume
Volume can be an essential confirmation tool. An OHLC bar showing a significant price move without accompanying volume could indicate a false breakout or lack of follow-through.
3. Timeframe Selection
The timeframe you choose for OHLC charts plays a critical role. Shorter timeframes may show more noise and false signals, while longer timeframes can provide a clearer picture of the overall trend.
Conclusion
OHLC trading is a vital concept in technical analysis that provides a clear and concise view of market price movements. By understanding the open, high, low, and close prices, traders can gain insights into market sentiment, volatility, and potential trends.
Whether you’re using bar charts or candlesticks, OHLC data is an essential tool for traders across all markets, from forex to commodities and cryptocurrencies.
By combining OHLC charts with other indicators and techniques, you can create a robust trading strategy that improves decision-making and boosts your chances of success in the markets.
FAQs
What’s the main difference between OHLC and candlestick charts?
Both show the same data, but candlestick charts use a more visually intuitive format with coloured bodies, making them easier to read for many traders.
How do I use OHLC to identify trends?
If the close price is consistently above the open price, it suggests an uptrend. If the close is below the open, it suggests a downtrend.
Can OHLC charts be used for all asset types?
Yes, OHLC charts can be used for any asset, including stocks, forex, commodities, and cryptocurrencies.
Share Now
Disclaimer:This content is provided for informational purposes only and does not constitute, and should not be construed as, financial, investment, or other professional advice. No statement or opinion contained herein should be considered a recommendation by Ultima Markets or the author regarding any specific investment product, strategy, or transaction. Readers are advised not to rely solely on this material when making investment decisions and should seek independent advice where appropriate.
Thank you for visiting the Ultima Markets website. Please note that this website is intended for individuals residing in jurisdictions where access is permitted by law. Ultima and its affiliated entities do not operate in your home jurisdiction.
By clicking ‘Acknowledge’, you confirm that you are entering this website solely on your own initiative and not as a result of any specific marketing outreach. You wish to obtain information from this website based on reverse solicitation principles, in accordance with the applicable laws of your home jurisdiction.