This website is managed by Ultima Markets’ international entities, and it’s important to emphasise that they are not subject to regulation by the FCA in the UK. Therefore, you must understand that you will not have the FCA’s protection when investing through this website – for example:
You will not be guaranteed Negative Balance Protection
You will not be protected by FCA’s leverage restrictions
You will not have the right to settle disputes via the Financial Ombudsman Service (FOS)
You will not be protected by Financial Services Compensation Scheme (FSCS)
Any monies deposited will not be afforded the protection required under the FCA Client Assets Sourcebook. The level of protection for your funds will be determined by the regulations of the relevant local regulator.
Note: UK clients are kindly invited to visit https://www.ultima-markets.co.uk/. Ultima Markets UK expects to begin onboarding UK clients in accordance with FCA regulatory requirements in 2026.
If you would like to proceed and visit this website, you acknowledge and confirm the following:
1.The website is owned by Ultima Markets’ international entities and not by Ultima Markets UK Ltd, which is regulated by the FCA.
2.Ultima Markets Limited, or any of the Ultima Markets international entities, are neither based in the UK nor licensed by the FCA.
3.You are accessing the website at your own initiative and have not been solicited by Ultima Markets Limited in any way.
4.Investing through this website does not grant you the protections provided by the FCA.
5.Should you choose to invest through this website or with any of the international Ultima Markets entities, you will be subject to the rules and regulations of the relevant international regulatory authorities, not the FCA.
Ultima Markets wants to make it clear that we are duly licensed and authorised to offer the services and financial derivative products listed on our website. Individuals accessing this website and registering a trading account do so entirely of their own volition and without prior solicitation.
By confirming your decision to proceed with entering the website, you hereby affirm that this decision was solely initiated by you, and no solicitation has been made by any Ultima Markets entity.
Discover what a spinning top candlestick means, learn how to identify it, and how traders use it to spot indecision or reversal signals in the market.
How to Use the Spinning Top Candlestick
In every market, price movement tells a story: one of momentum, balance, and uncertainty. Traders rely on candlestick patterns to read that story, using them to gauge whether buyers or sellers are in control. Among these patterns, few capture indecision as clearly as the spinning top candlestick.
This pattern doesn’t shout a trend reversal or scream a breakout; instead, it quietly signals hesitation. It tells you that both sides have tried to move the market but ended up almost where they started. Recognising this moment of balance can help traders prepare for what often comes next, a shift in direction or a short pause before the trend resumes.
What Is a Spinning Top Candlestick
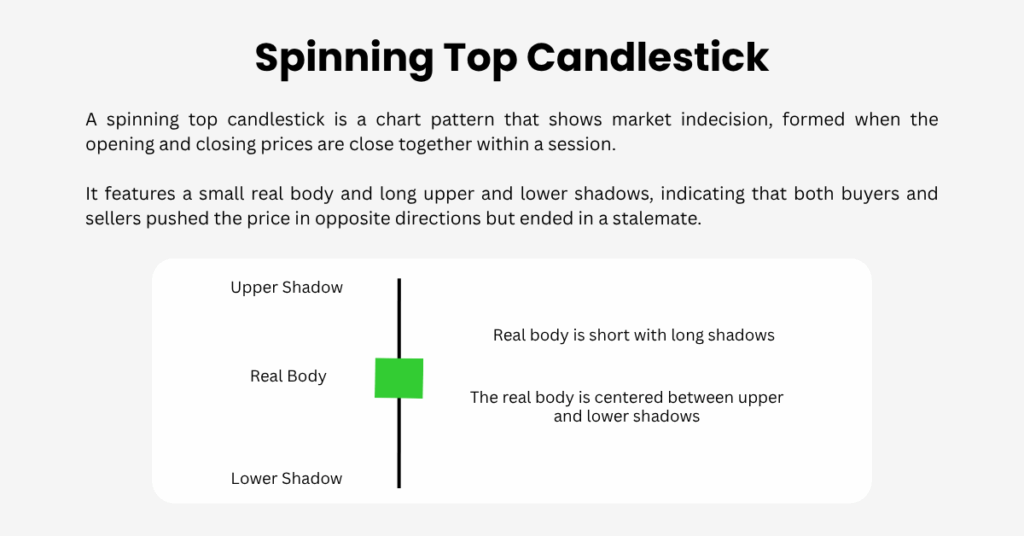
A spinning top candlestick is a common chart pattern that reflects market indecision. It features a small real body positioned roughly in the middle of long upper and lower shadows. The body represents the distance between the opening and closing prices, while the shadows show how far prices moved during the trading period.
In simple terms, both buyers and sellers were active. The price moved significantly in both directions, yet neither side could take control. That’s why this pattern signals a pause or balance in market sentiment.
The name comes from the toy “spinning top”: it wobbles back and forth before falling in one direction. Similarly, when this candlestick appears, the market is spinning between bulls and bears, waiting for clarity.
How to Recognise a Spinning Top
A spinning top candlestick is easy to identify once you know what to look for.
Short Real Body: The open and close prices are close together, creating a short central body.
Long Upper and Lower Shadows: Both wicks are long, showing that the price travelled far above and below the open before closing near the starting point.
Body Near the Centre: The real body should be approximately centred between the shadows. It doesn’t need to be perfectly in the middle, just close.
Colour Doesn’t Matter: The candle can be bullish or bearish; what matters is the indecision it represents.
This balanced structure tells us that buying and selling pressure were equally matched during the session. A sign of hesitation in the market.
What a Spinning Top Means
When a spinning top forms, it’s often the market’s way of saying, “We’re not sure what comes next.” Traders interpret it as a sign that momentum may be slowing or that a reversal or consolidation could be near.
After a strong uptrend, a spinning top suggests that buyers may be losing control and that sellers could start to step in.
After a downtrend, it can mean sellers are losing strength, hinting that buyers might soon regain ground.
During sideways markets, it may simply confirm ongoing indecision, without implying any new trend.
However, the key word here is may. A spinning top by itself doesn’t confirm anything. It’s a first clue, not a final answer.
Example: Gold Chart Case
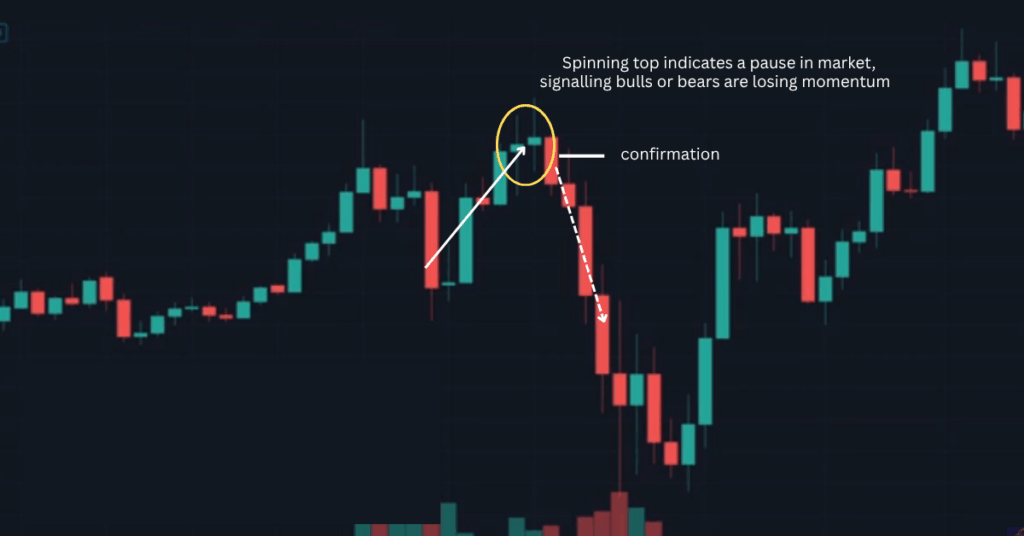
A useful example comes from a gold-price chart. After several days of strong bullish candles, two spinning tops appeared at the top of the rally. Their small, centred bodies and long shadows showed that buyers were losing momentum.
Following these two spinning tops, a large red candle formed. This is a clear sign that sellers had taken control. The price then dropped sharply, confirming the reversal.
This sequence shows how spinning tops can provide an early warning that momentum is fading, but also why confirmation from the next candle is crucial before acting.
Why Confirmation Is Essential
Many beginners mistake the spinning top for a guaranteed reversal signal. In reality, it’s simply an alert that the market’s balance may be shifting.
Sometimes, after a spinning top forms, prices will move sideways for several sessions before continuing in the same direction. Other times, a strong breakout follows immediately. Because of this uncertainty, traders always look for confirmation before entering a trade.
Confirmation can come in several forms:
A large candle in the opposite direction (e.g. a strong red candle after an uptrend).
A breakout beyond the spinning top’s high or low.
Supporting signals from indicators like RSI, MACD, or volume decline.
Without these clues, trading solely on a spinning top can lead to false entries.
How to Trade the Spinning Top Candlestick
If you plan to use spinning tops in your trading strategy, follow a structured approach:
Identify Context: Confirm that the pattern appears after a clear trend, not inside a flat range.
Wait for Confirmation: Always wait for the next candle to confirm direction.
Use Support and Resistance: A spinning top near a key resistance in an uptrend or near support in a downtrend has more meaning.
Combine With Indicators: Look for volume drops, divergence in momentum, or MACD crossovers to support the setup.
Apply Risk Management: Use stop-loss orders just outside the candle’s high or low to protect against false breakouts.
This disciplined method turns the spinning top from a simple visual pattern into a calculated decision tool.
Spinning Top vs. Doji
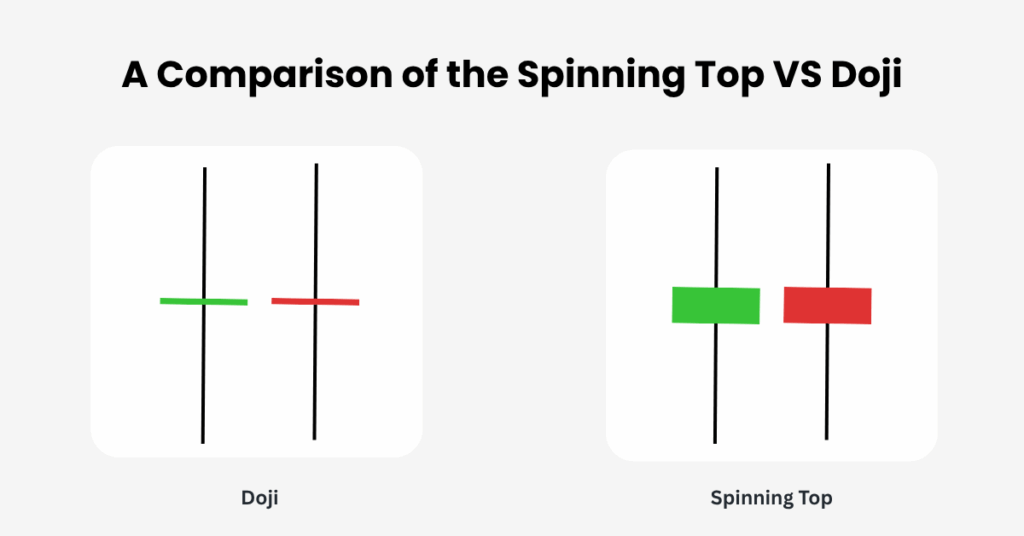
At first glance, a spinning top candlestick can look a lot like a doji, since both patterns signal indecision. However, they are not the same. The difference lies mainly in the size of the body and the strength of the message they send about market balance.
Traders often confuse spinning tops with doji candles, since both represent indecision.
A Doji has almost no real body. The open and close are virtually identical.
A Spinning Top has a small but visible body, meaning there was a slight shift between opening and closing prices.
Both patterns indicate market hesitation, but the doji is the stronger sign of pure equilibrium, while the spinning top tends to appear more frequently and signals mild uncertainty.
How Reliable Is the Spinning Top?
Statistically, spinning tops occur often but have moderate reliability. Research from trading pattern studies shows a win rate of around 55%, which means they’re best used as a context clue rather than a standalone signal.
In practice, spinning tops are more reliable on longer timeframes such as 4-hour or daily charts, where noise is lower and trend structure is clearer. On shorter charts, frequent false signals can appear due to random volatility.
Therefore, think of this candlestick as a pause in momentum, not an order to reverse.
Common Mistakes to Avoid
Trading Without Confirmation: Acting immediately on a spinning top without follow-up evidence is risky.
Ignoring the Trend: A spinning top in a strong uptrend often just signals a short-term pause, not a full reversal.
Over-relying on the Pattern: Use it with volume, support/resistance, or momentum indicators.
Using Too Small Timeframes: Lower-timeframe spinning tops are often noise.
Skipping Risk Management: Always protect your capital with stop-losses and proper sizing.
Final Thoughts
The spinning top candlestick is one of the simplest yet most informative visual patterns in technical analysis. It captures a moment of hesitation, a point where buyers and sellers test each other’s strength.
Used correctly, it helps traders recognise when momentum is fading, when a pause may occur, or when a potential reversal is brewing. But success comes from what you do next: confirm, validate, and manage risk before acting.
Whether you trade forex, commodities, or stocks, mastering candlestick interpretation and combining it with sound strategy and regulated platforms turns small signals like the spinning top into powerful decision tools for smarter trading.
Share Now
Disclaimer:This content is provided for informational purposes only and does not constitute, and should not be construed as, financial, investment, or other professional advice. No statement or opinion contained herein should be considered a recommendation by Ultima Markets or the author regarding any specific investment product, strategy, or transaction. Readers are advised not to rely solely on this material when making investment decisions and should seek independent advice where appropriate.
Thank you for visiting the Ultima Markets website. Please note that this website is intended for individuals residing in jurisdictions where access is permitted by law. Ultima and its affiliated entities do not operate in your home jurisdiction.
By clicking ‘Acknowledge’, you confirm that you are entering this website solely on your own initiative and not as a result of any specific marketing outreach. You wish to obtain information from this website based on reverse solicitation principles, in accordance with the applicable laws of your home jurisdiction.