This website is managed by Ultima Markets’ international entities, and it’s important to emphasise that they are not subject to regulation by the FCA in the UK. Therefore, you must understand that you will not have the FCA’s protection when investing through this website – for example:
You will not be guaranteed Negative Balance Protection
You will not be protected by FCA’s leverage restrictions
You will not have the right to settle disputes via the Financial Ombudsman Service (FOS)
You will not be protected by Financial Services Compensation Scheme (FSCS)
Any monies deposited will not be afforded the protection required under the FCA Client Assets Sourcebook. The level of protection for your funds will be determined by the regulations of the relevant local regulator.
Note: UK clients are kindly invited to visit https://www.ultima-markets.co.uk/. Ultima Markets UK expects to begin onboarding UK clients in accordance with FCA regulatory requirements in 2026.
If you would like to proceed and visit this website, you acknowledge and confirm the following:
1.The website is owned by Ultima Markets’ international entities and not by Ultima Markets UK Ltd, which is regulated by the FCA.
2.Ultima Markets Limited, or any of the Ultima Markets international entities, are neither based in the UK nor licensed by the FCA.
3.You are accessing the website at your own initiative and have not been solicited by Ultima Markets Limited in any way.
4.Investing through this website does not grant you the protections provided by the FCA.
5.Should you choose to invest through this website or with any of the international Ultima Markets entities, you will be subject to the rules and regulations of the relevant international regulatory authorities, not the FCA.
Ultima Markets wants to make it clear that we are duly licensed and authorised to offer the services and financial derivative products listed on our website. Individuals accessing this website and registering a trading account do so entirely of their own volition and without prior solicitation.
By confirming your decision to proceed with entering the website, you hereby affirm that this decision was solely initiated by you, and no solicitation has been made by any Ultima Markets entity.
The green hammer candlestick shows buyers regaining control after a decline. Find out how to spot it, confirm the signal, and build your trading strategy.
How to Trade the Green Hammer Candlestick
A green hammer candlestick is a bullish reversal pattern that usually appears after a downtrend, signaling that buyers are regaining control of the market. Unlike the red hammer, which closes below its opening price, the green hammer closes higher, showing stronger buying pressure and a clearer shift in sentiment.
We’ve previously covered the red hammer candlestick, which signals a potential reversal but often requires stronger confirmation due to its bearish close. The green hammer, by contrast, is considered a more decisive signal because it shows buyers closing the session above the open. In this article, we’ll explore how to recognise and trade the green hammer effectively.
What Is a Green Hammer Candlestick?
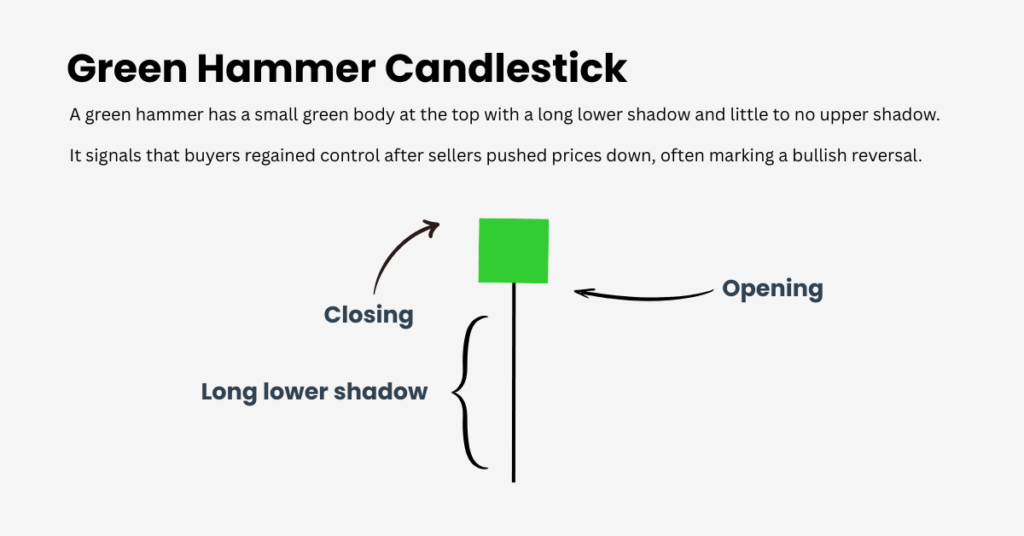
The shape of the green hammer is straightforward: a small green body positioned near the top of the candle, a long lower shadow at least twice the size of the body, and little to no upper shadow.
This structure shows that although sellers pushed the price lower during the session, buyers regained control and forced a close above the opening level. The result is often a potential shift from bearish to bullish momentum.
Why the Green Hammer Matters for Traders
The green hammer is more than just a candlestick. It represents a turning point in market psychology. At first, sellers dominate, forcing prices down and continuing the trend. However, by the end of the session, buyers reverse the momentum, pushing the price higher than the open and rejecting lower levels. This strong close signals confidence from the bulls and highlights the possibility of a shift in sentiment.
For beginners, the green hammer offers a clear and simple way to recognise potential reversals without relying on advanced indicators. Because the candle is easy to spot and works across markets—stocks, forex, and commodities—it serves as a valuable learning tool for traders starting out.
How to Recognise a Green Hammer Candlestick Pattern
To properly identify a green hammer, context is key. Recognising when the pattern appears in the right market conditions is crucial. Follow this step-by-step checklist to spot a green hammer correctly.
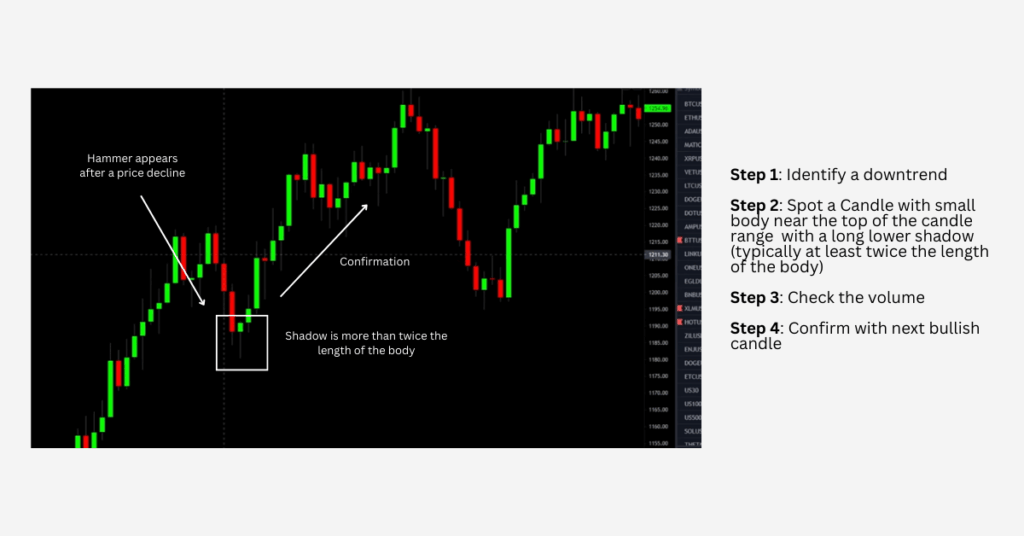
Identify the Downtrend – Look for a clear sequence of lower highs and lower lows, as the pattern formed at the end of a downtrend signals a potential reversal.
Check the Candle Shape – Small green body, long lower shadow, minimal upper shadow.
Look at Volume – High trading volume when the pattern is formed increases the reliability of the signal.
Wait for Confirmation – Wait for a confirmation candle that provides bullish confirmation, such as a bullish candle closing above the hammer’s high.
Plan Your Entry – Traders typically enter long after the breakout above the hammer.
Place a Stop-Loss – Always set it below the hammer’s low to manage risk.
Spotting the Ideal Downtrend for a Green Hammer
Not every hammer carries the same weight. Signals are strongest after a well‑established decline with persistent lower highs and lower lows. Confluence at key support, meaning previous swing lows, trendline support, round numbers, or Fibonacci retracements, adds credibility. When a green hammer appears at such levels, it suggests active defense by buyers and raises the odds of a sustained rebound.
Case Study: Gold (XAUUSD)
This example shows how the pattern can play out in real time and how to execute around it.
Step 1 — Confirm the backdrop. Gold has been declining, printing lower highs and lower lows. That downtrend provides the context a hammer requires.
Step 2 — Spot the hammer. On the chart, a clear hammer forms: a small real body near the top with a pronounced lower shadow.
Step 3 — Verify proportions. The lower shadow is more than twice the size of the real body, satisfying a key structural criterion.
Step 4 — Check location and confluence. The hammer appears after the price decline and near support, increasing the credibility of a potential turn.
Step 5 — Wait for confirmation. The next candle pushes above the hammer’s high, and price follows with a clean bounce to the upside—the pattern “plays out” as expected.
Step 6 — Execute and manage. A typical plan is to enter on the break or close above the hammer’s high, place a stop below the hammer’s low, and stage profit targets at nearby resistance. As price advances, consider trailing the stop under emerging higher lows.
How to Trade the Green Hammer
The green hammer candlestick follows the same trading logic as other reversal patterns, but its bullish close often gives traders more confidence than the red hammer. The safest approach is still to wait for confirmation — ideally a candle closing above the hammer’s high to show that buyers are following through. In some cases, traders may choose to enter earlier if the hammer forms at strong support and trading volume is picking up.
Risk management is essential. Most traders place a stop-loss just below the hammer’s low, while profit targets are usually set at nearby resistance levels or Fibonacci retracement zones. The setup becomes even stronger when supported by other signals, such as RSI bouncing from oversold, a bullish MACD crossover, or the hammer forming near the 50- or 200-day moving average.so
Types of Hammer Candlesticks
The green hammer is just one member of a larger candlestick family. Understanding the other types can help avoid confusion and improve your strategy.
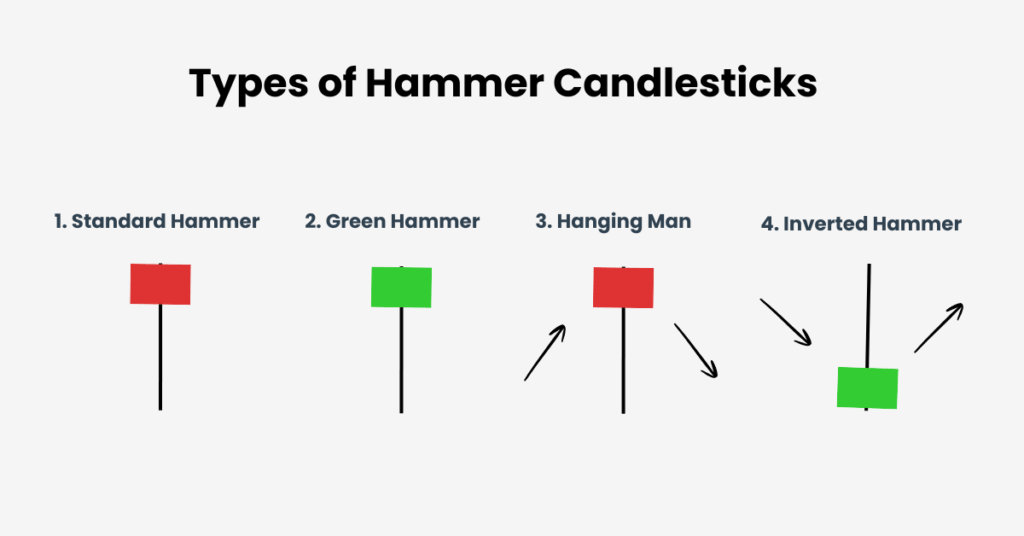
Standard Hammer – Small body at the top with a long lower shadow, signals bullish reversal. Regardless of colour.
Green Hammer – A stronger variation, as buyers close above the open.
Hanging Man – Looks similar but forms after an uptrend, signaling potential bearish reversal.
Inverted Hammer – Appears after a downtrend with a long upper shadow, requires confirmation to validate bullish reversal.
Limitations of Hammer Candlesticks
Like all candlestick patterns, hammers aren’t perfect. To use them effectively, it’s important to be aware of their limitations. In volatile markets, hammer candlesticks can sometimes produce false signals, leading traders to anticipate a reversal that never materialises.
The reliability of the hammer pattern also depends heavily on the overall market trend and the context in which it appears. For this reason, traders should always use hammer candlesticks in conjunction with other technical indicators and consider the broader market environment before making trading decisions.
Additionally, hammer candlesticks are generally short-term signals and may not provide insight into longer-term trends. By understanding these limitations and integrating hammer candlesticks into a comprehensive trading strategy, traders can use them more effectively and avoid common pitfalls.
Key Takeaways
The green hammer is one of the clearest single‑bar clues that buyers are reasserting control after a decline. Its green close makes it a stronger bullish hint than the red hammer, but confirmation and context still matter.
When used correctly, the green hammer candlestick provides traders with a straightforward yet effective way to spot potential turning points in the market.
Share Now
Disclaimer:This content is provided for informational purposes only and does not constitute, and should not be construed as, financial, investment, or other professional advice. No statement or opinion contained herein should be considered a recommendation by Ultima Markets or the author regarding any specific investment product, strategy, or transaction. Readers are advised not to rely solely on this material when making investment decisions and should seek independent advice where appropriate.
Thank you for visiting the Ultima Markets website. Please note that this website is intended for individuals residing in jurisdictions where access is permitted by law. Ultima and its affiliated entities do not operate in your home jurisdiction.
By clicking ‘Acknowledge’, you confirm that you are entering this website solely on your own initiative and not as a result of any specific marketing outreach. You wish to obtain information from this website based on reverse solicitation principles, in accordance with the applicable laws of your home jurisdiction.