Important Information

This website is managed by Ultima Markets’ international entities, and it’s important to emphasise that they are not subject to regulation by the FCA in the UK. Therefore, you must understand that you will not have the FCA’s protection when investing through this website – for example:

  • You will not be guaranteed Negative Balance Protection
  • You will not be protected by FCA’s leverage restrictions
  • You will not have the right to settle disputes via the Financial Ombudsman Service (FOS)
  • You will not be protected by Financial Services Compensation Scheme (FSCS)
  • Any monies deposited will not be afforded the protection required under the FCA Client Assets Sourcebook. The level of protection for your funds will be determined by the regulations of the relevant local regulator.

Note: UK clients are kindly invited to visit https://www.ultima-markets.co.uk/. Ultima Markets UK expects to begin onboarding UK clients in accordance with FCA regulatory requirements in 2026.

If you would like to proceed and visit this website, you acknowledge and confirm the following:

  • 1.The website is owned by Ultima Markets’ international entities and not by Ultima Markets UK Ltd, which is regulated by the FCA.
  • 2.Ultima Markets Limited, or any of the Ultima Markets international entities, are neither based in the UK nor licensed by the FCA.
  • 3.You are accessing the website at your own initiative and have not been solicited by Ultima Markets Limited in any way.
  • 4.Investing through this website does not grant you the protections provided by the FCA.
  • 5.Should you choose to invest through this website or with any of the international Ultima Markets entities, you will be subject to the rules and regulations of the relevant international regulatory authorities, not the FCA.

Ultima Markets wants to make it clear that we are duly licensed and authorised to offer the services and financial derivative products listed on our website. Individuals accessing this website and registering a trading account do so entirely of their own volition and without prior solicitation.

By confirming your decision to proceed with entering the website, you hereby affirm that this decision was solely initiated by you, and no solicitation has been made by any Ultima Markets entity.

I confirm my intention to proceed and enter this website Please direct me to the website operated by Ultima Markets , regulated by the FCA in the United Kingdom
Roll Arrow

S&P 500 Valuations Hit Unprecedented Levels


While the S&P 500 has repeatedly set new all-time highs, its valuation metrics have also soared. The index’s price-to-sales ratio has reached a historic high of 3.23x. Although its price-to-earnings ratio has not hit a record, it remains at an extremely elevated level historically.


Tech Giants Dominate Market Landscape

The largest U.S. technology companies, led by Nvidia and Microsoft, continue to justify their valuations with rapid growth in sales and profits.

These firms have established a dominant position in the market. As of the end of July, the 10 largest companies in the S&P 500 accounted for a record 39.5% of the index’s total market capitalization, with nine of those companies boasting market caps exceeding $1 trillion.

The S&P 500’s valuation has reached historic highs on several metrics. Based on revenue, investors are now paying a record price for every $1 of sales from the index’s constituent companies, with the price-to-sales ratio hitting 3.23x on Thursday.

In terms of price-to-earnings, the S&P 500 is currently trading at 22.5 times forward 12-month earnings estimates, well above the average of 16.8 times since the year 2000. While the P/E ratio has not reached an all-time record, supported by the strong profit margins of the index’s most valuable companies, it remains in an extreme historical range.


S&P 500 Warrants Caution on Potential Correction

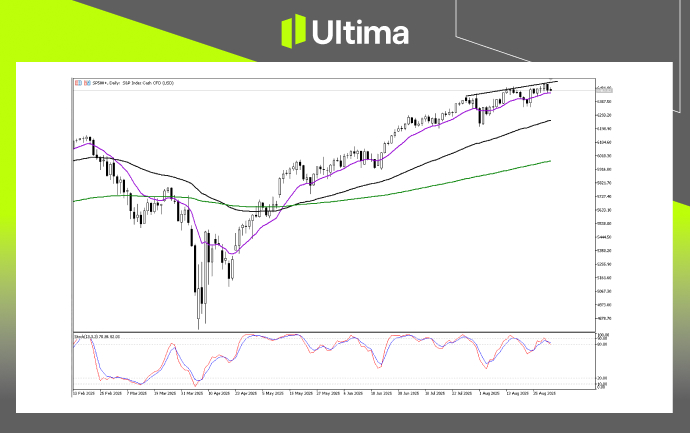
From a technical perspective, after setting a new high last Thursday, the S&P 500 closed with a bearish engulfing pattern on the daily chart, suggesting a significant probability of a deeper correction this week.

Notably, the S&P’s price is currently encountering resistance at the upper bound of an alternative trendline, forming a potential bearish Wolfe Wave structure. Therefore, if the index price breaks below last Friday’s low—which also serves as the support level for the purple 13-period moving average—the probability of a deep correction would increase.


SP500, Day Chart | Source: Ultima Market MT5

Disclaimer  

Comments, news, research, analysis, price, and all information contained in the article only serve as general information for readers and do not suggest any advice. Ultima Markets has taken reasonable measures to provide up-to-date information, but cannot guarantee accuracy, and may modify without notice. Ultima Markets will not be responsible for any loss incurred due to the application of the information provided.


Share Now

  • Article Details
  • Article Details
  • Article Details

Thank you for visiting the Ultima Markets website. Please note that this website is intended for individuals residing in jurisdictions where access is permitted by law. Ultima and its affiliated entities do not operate in your home jurisdiction.

By clicking ‘Acknowledge’, you confirm that you are entering this website solely on your own initiative and not as a result of any specific marketing outreach. You wish to obtain information from this website based on reverse solicitation principles, in accordance with the applicable laws of your home jurisdiction.