This website is managed by Ultima Markets’ international entities, and it’s important to emphasise that they are not subject to regulation by the FCA in the UK. Therefore, you must understand that you will not have the FCA’s protection when investing through this website – for example:
You will not be guaranteed Negative Balance Protection
You will not be protected by FCA’s leverage restrictions
You will not have the right to settle disputes via the Financial Ombudsman Service (FOS)
You will not be protected by Financial Services Compensation Scheme (FSCS)
Any monies deposited will not be afforded the protection required under the FCA Client Assets Sourcebook. The level of protection for your funds will be determined by the regulations of the relevant local regulator.
Note: UK clients are kindly invited to visit https://www.ultima-markets.co.uk/. Ultima Markets UK expects to begin onboarding UK clients in accordance with FCA regulatory requirements in 2026.
If you would like to proceed and visit this website, you acknowledge and confirm the following:
1.The website is owned by Ultima Markets’ international entities and not by Ultima Markets UK Ltd, which is regulated by the FCA.
2.Ultima Markets Limited, or any of the Ultima Markets international entities, are neither based in the UK nor licensed by the FCA.
3.You are accessing the website at your own initiative and have not been solicited by Ultima Markets Limited in any way.
4.Investing through this website does not grant you the protections provided by the FCA.
5.Should you choose to invest through this website or with any of the international Ultima Markets entities, you will be subject to the rules and regulations of the relevant international regulatory authorities, not the FCA.
Ultima Markets wants to make it clear that we are duly licensed and authorised to offer the services and financial derivative products listed on our website. Individuals accessing this website and registering a trading account do so entirely of their own volition and without prior solicitation.
By confirming your decision to proceed with entering the website, you hereby affirm that this decision was solely initiated by you, and no solicitation has been made by any Ultima Markets entity.
Ultima Markets does not have an establishment in Singapore and does not operate from Singapore.
Ultima Markets does not provide products or services to citizens or residents of Singapore, and account applications from Singapore citizens or residents will not be accepted.
If you are a citizen or resident of Singapore, please do not open an account or use Ultima Markets’ products or services.
By selecting “Acknowledge and Continue Browsing”, you confirm that you are accessing this website on your own initiative and that your access is not the result of any direct marketing, targeted advertising, solicitation, or promotional activity by Ultima Markets.
Nothing on this website constitutes an offer, solicitation, or promotion of products or services in any jurisdiction where such activity is prohibited. You are responsible for ensuring that your access to and use of this website complies with applicable local laws and regulations.
S&P500 Analysis: Is the Index Poised for a Rebound or Another Leg Down?
S&P500 Analysis: Is the Index Poised for a Rebound or Another Leg Down?
shawn
In this comprehensive analysis, Ultima Markets brings you an insightful breakdown of the SP500 for November 14, 2025.
Technical Analysis of SP500
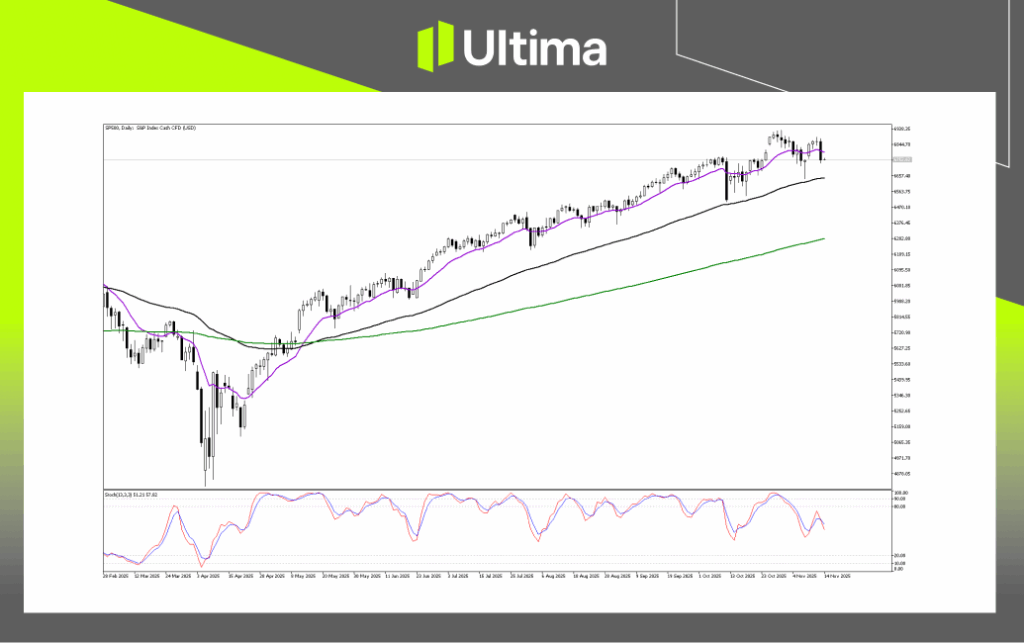
SP500 Daily Chart Insight
While the long-term trend remains upward, the short-term momentum is currently fading. The price has pulled back from the recent all-time highs near 6938 and is currently testing dynamic support levels. The Stochastic oscillator displayed in the bottom panel has crossed downward from the overbought zone above 80 and is currently reading near the midpoint at approximately 51-57. Such a development suggests that the aggressive buying pressure has paused and the market is undergoing a healthy correction or profit-taking phase.
Regarding momentum, the gap between the current price and the long-term green moving average is quite wide, which often precedes a period of consolidation known as mean reversion. Such consolidation allows the moving averages to catch up to the price action before the next potential move.
Key Levels: The price is currently testing the short-term moving average (purple line) around 6750 to 6760, serving as immediate support. A daily close below would suggest weakness.
The most critical medium-term support lies at approximately 6560 to 6600, coinciding with the medium-term moving average (black line). Historically, as seen in June and August, the price has bounced significantly from the black line.
The long-term moving average (green line) at around 6280 serves as the trend floor. A drop to such a level would represent a major correction, though the scenario remains unlikely in the immediate future.
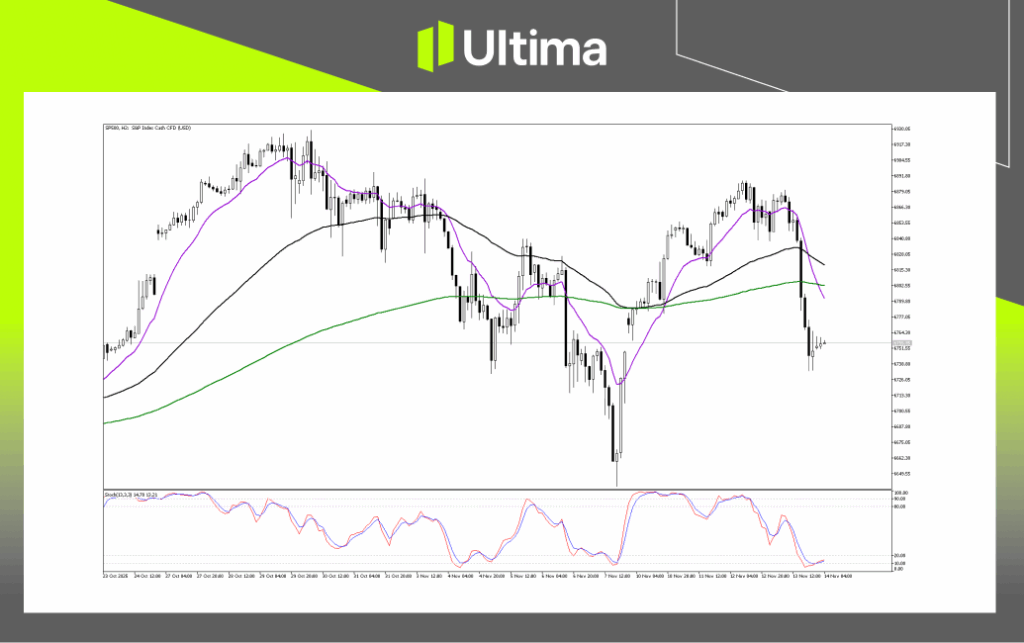
SP500 2-Hour Chart Analysis
The market currently finds itself in a precarious position. Although the dominant trend has turned bearish, the extremely oversold conditions indicate a high probability of a bounce. Traders should monitor the immediate support at 6725 and the key resistance cluster at 6800 to 6815 to determine the market’s next directional move.
Breakout Scenarios: A breakdown indicating bearish continuation would be signaled by a sustained break and 2-hour candle close below the immediate support at 6725. Such a move would confirm that the bears remain in full control and that the current pause is temporary, with the next logical target being the major support level at 6660.
Given the oversold condition, a bounce is highly probable. The first sign of a bullish recovery would be the price reclaiming the 6780 level. A true bullish breakout would require the price to push through and close above the cluster of moving averages at 6800 to 6815. A confirmed breakout above the resistance zone would suggest the sharp sell-off was merely a correction and could trigger a rally back towards the secondary resistance at 6850.
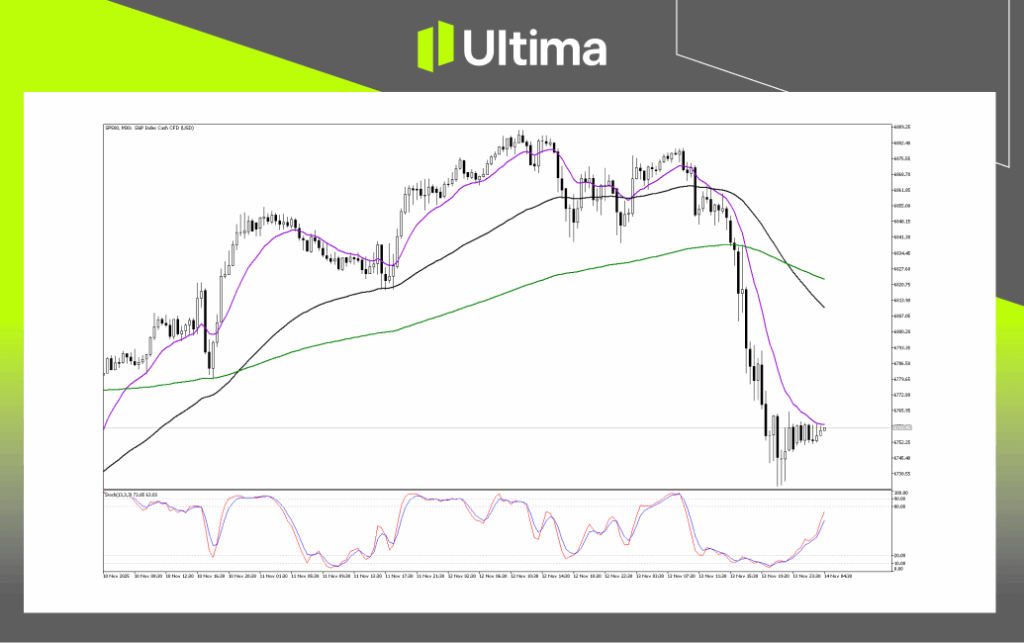
SP500 Pivot Indicator
Following the sharp drop, the price action has stalled and entered a very tight sideways consolidation or range-bound phase. This indicates a temporary equilibrium between buyers and sellers as the market digests the recent aggressive move.
Breakout (Bullish Relief Rally): A bullish relief rally would be signaled by a decisive 30-minute candle close above the immediate resistance and the purple moving average at 6770. A successful push through the level would likely trigger a short-covering rally. The first target would be 6790 to 6800, with a more significant target at the major resistance zone of 6810 to 6830. The scenario is supported by the rising Stochastic oscillator.
Breakdown (Bearish Continuation): A bearish continuation breakdown would be signaled by a sustained 30-minute candle close below the critical support floor at 6738. Such a move would confirm that the current consolidation was merely a “bear flag” or a brief pause before the next wave of selling. A breakdown would invalidate the potential for a bounce and signal a continuation of the downtrend, with traders likely targeting lower psychological levels such as 6720 and 6700.
How to Navigate the Forex Market with Ultima Markets
To navigate the complex world of trading successfully, it’s imperative to stay informed and make data-driven decisions. Ultima Markets remains dedicated to providing you with valuable insights to empower your financial journey. For personalized guidance tailored to your specific financial situation, please do not hesitate to contact Ultima Markets.
Join Ultima Markets today and access a comprehensive trading ecosystem equipped with the tools and knowledge needed to thrive in the financial markets. Stay tuned for more updates and analyses from our team of experts at Ultima Markets.
—–
Legal Documents
Trading leveraged derivative products carries a high level of risk and may not be suitable for all investors. Leverage can magnify both gains and losses, potentially resulting in rapid and substantial capital loss. Before trading, carefully assess your investment objectives, level of experience, and risk tolerance. If you are uncertain, seek advice from a licensed financial adviser. Leveraged products are not intended for inexperienced investors who do not fully understand the risks or who are unable to bear the possibility of significant losses.
Comments, news, research, analysis, price, and all information contained in the article only serve as general information for readers and do not suggest any advice. Ultima Markets has taken reasonable measures to provide up-to-date information, but cannot guarantee accuracy, and may modify without notice. Ultima Markets will not be responsible for any loss incurred due to the application of the information provided.
Thank you for visiting the Ultima Markets website. Please note that this website is intended for individuals residing in jurisdictions where access is permitted by law. Ultima and its affiliated entities do not operate in your home jurisdiction.
By clicking ‘Acknowledge’, you confirm that you are entering this website solely on your own initiative and not as a result of any specific marketing outreach. You wish to obtain information from this website based on reverse solicitation principles, in accordance with the applicable laws of your home jurisdiction.