In this comprehensive analysis, Ultima Markets brings you an insightful breakdown of the China A50 for 11th April 2024.
Key Takeaways
- U.S. inflation data: The U.S. CPI in March rose 3.5% year-on-year, reaching a six-month high, with the core CPI recording 3.8% year-on-year for the third consecutive month, which is higher than the expected 3.7%. The market bets that the probability of the Federal Reserve cutting interest rates in June is less than 20%, and the number of rate cuts for the whole year is less than two.
- Federal Reserve meeting minutes: Almost all participants agreed that it is appropriate to cut interest rates this year and are prepared to slow down the pace of Treasury bond divestment “fairly soon,” with a preference to reduce the monthly pace of quantitative tightening by about half.
Technical Analysis
Daily Chart Insights
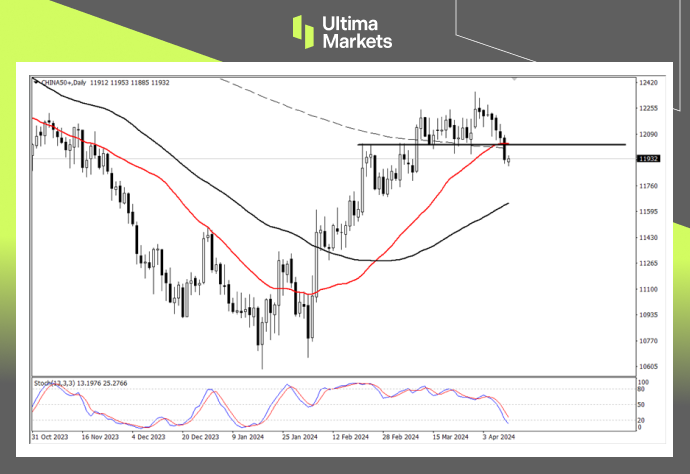
- Stochastic oscillator: The indicator has issued a bearish signal above the 50 midline for the second time, while the exchange rate has risen, forming a divergence pattern at the top. This suggests that the bullish momentum is weakening, and short-term opportunities to go short are worth paying attention to.
- Top pattern: The market price formed a rounded top above the dashed 200-period moving average, and after completely breaking through the support of the moving average yesterday, the top structure was established. If today’s retest does not break the neckline, it is worth paying attention to the opportunity to go short.
1-hour Chart Analysis
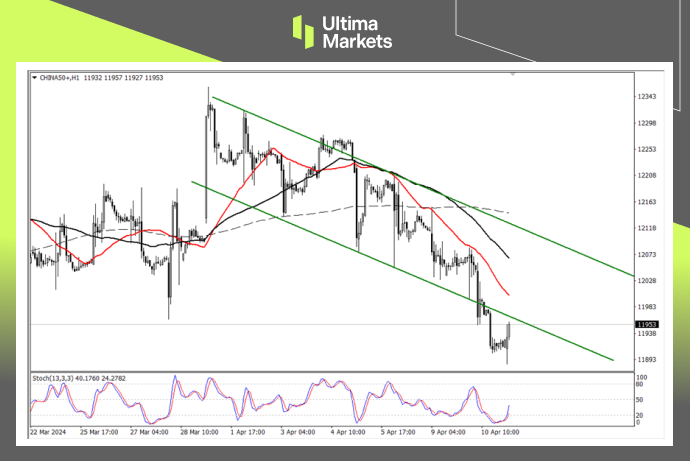
- Stochastic oscillator: After entering the oversold range, the indicator issued a bullish signal, and the market price is expected to rebound in the short term. After the indicator leaves the oversold area, pay attention to the appearance of bearish signals.
- Rebound high point: After the overall trend of the A50 formed a downward channel line, it accelerated its decline yesterday, and there is a certain need for mean reversion in the short term. Pay attention to the moving resistance of the red 33-period moving average above.
Pivot Indicator
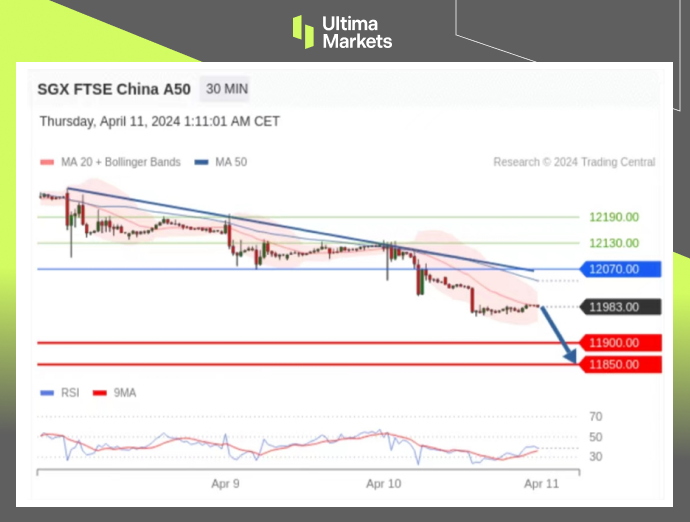
- According to the trading central in Ultima Markets APP, the central price of the day is established at 12070,
- Bullish Scenario: Bullish sentiment prevails above 12070, first target 12130, second target 12190;
- Bearish Outlook: In a bearish scenario below 12070, first target 11900, second target 11850.
Conclusion
To navigate the complex world of trading successfully, it’s imperative to stay informed and make data-driven decisions. Ultima Markets remains dedicated to providing you with valuable insights to empower your financial journey.
For personalized guidance tailored to your specific financial situation, please do not hesitate to contact Ultima Markets.
Join Ultima Markets today and access a comprehensive trading ecosystem equipped with the tools and knowledge needed to thrive in the financial markets.
Stay tuned for more updates and analyses from our team of experts at Ultima Markets.
—–
Legal Documents
Ultima Markets, a trading name of Ultima Markets Ltd, is authorized and regulated by the Financial Services Commission “FSC” of Mauritius as an Investment Dealer (Full-Service Dealer, excluding Underwriting) (license No. GB 23201593). The registered office address: 2nd Floor, The Catalyst, 40 Silicon Avenue, Ebene Cybercity, 72201, Mauritius.
Copyright © 2024 Ultima Markets Ltd. All rights reserved.
Disclaimer
Comments, news, research, analysis, price, and all information contained in the article only serve as general information for readers and do not suggest any advice. Ultima Markets has taken reasonable measures to provide up-to-date information, but cannot guarantee accuracy, and may modify without notice. Ultima Markets will not be responsible for any loss incurred due to the application of the information provided.