Important Information
This website is managed by Ultima Markets’ international entities, and it’s important to emphasise that they are not subject to regulation by the FCA in the UK. Therefore, you must understand that you will not have the FCA’s protection when investing through this website – for example:
- You will not be guaranteed Negative Balance Protection
- You will not be protected by FCA’s leverage restrictions
- You will not have the right to settle disputes via the Financial Ombudsman Service (FOS)
- You will not be protected by Financial Services Compensation Scheme (FSCS)
- Any monies deposited will not be afforded the protection required under the FCA Client Assets Sourcebook. The level of protection for your funds will be determined by the regulations of the relevant local regulator.
Note: UK clients are kindly invited to visit https://www.ultima-markets.co.uk/. Ultima Markets UK expects to begin onboarding UK clients in accordance with FCA regulatory requirements in 2026.
If you would like to proceed and visit this website, you acknowledge and confirm the following:
- 1.The website is owned by Ultima Markets’ international entities and not by Ultima Markets UK Ltd, which is regulated by the FCA.
- 2.Ultima Markets Limited, or any of the Ultima Markets international entities, are neither based in the UK nor licensed by the FCA.
- 3.You are accessing the website at your own initiative and have not been solicited by Ultima Markets Limited in any way.
- 4.Investing through this website does not grant you the protections provided by the FCA.
- 5.Should you choose to invest through this website or with any of the international Ultima Markets entities, you will be subject to the rules and regulations of the relevant international regulatory authorities, not the FCA.
Ultima Markets wants to make it clear that we are duly licensed and authorised to offer the services and financial derivative products listed on our website. Individuals accessing this website and registering a trading account do so entirely of their own volition and without prior solicitation.
By confirming your decision to proceed with entering the website, you hereby affirm that this decision was solely initiated by you, and no solicitation has been made by any Ultima Markets entity.
I confirm my intention to proceed and enter this website Please direct me to the website operated by Ultima Markets , regulated by the FCA in the United Kingdom
Ultima Markets App
Trade Anytime, Anywhere


Focus on AUD/USD Today – 28th Sep 2023

Comprehensive AUD/USD Analysis for September 28, 2023
In this comprehensive analysis, Ultima Markets brings you an insightful breakdown of AUD/USD for 28th September 2023.
Key Takeaways
- Australian Inflation: Australian inflation reached a notable 5.2% in September 2023, in line with market expectations. This marked a significant uptick since June and is primarily attributed to the depreciation of the Australian dollar and rising oil prices.
- Market Perception: The market’s consensus was that these inflationary pressures, while substantial, would not be adequate to persuade the RBA to pursue an interest rate hike strategy. As a result, the initial reaction in the currency markets was mixed. The Australian dollar experienced a short-lived appreciation, but the prevailing sentiment soon led to a decline.
Short-Term vs. Long-Term Impact
- Short-Term Outlook: The short-term Australian data had a limited impact on the currency pair. Market attention swiftly shifted to the United States, with a specific focus on the core PCE data. Should this data continue to show an upward trend, it could maintain the possibility of interest rate hikes during the year, consequently bolstering the US dollar.
- Budgetary Concerns: However, the situation in the United States presents a significant variable. The fiscal year for 2023 is concluding, and if political parties fail to reach an agreement on the budget, the risk of a government shutdown looms large. In such an event, the market may seize the opportunity to speculate on a weakening US dollar.
Technical Analysis
AUD/USD Daily Chart Analysis
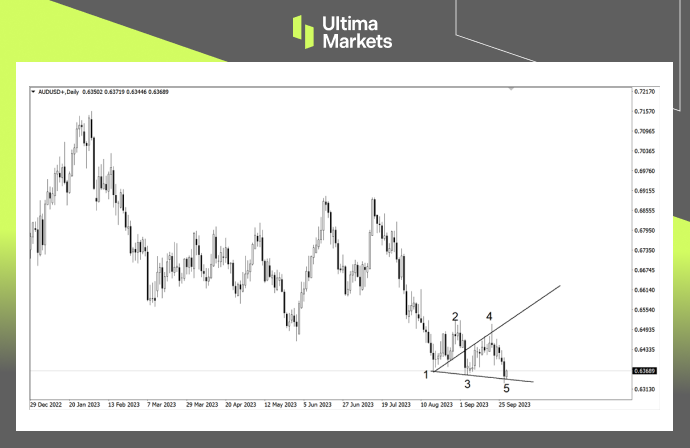
(Daily chart of AUD/USD, source: Ultima Markets MT4)
Significant Decline: The daily chart indicated an expected decline in the exchange rate following the inflation data release. Subsequently, the market exhibited a distinctive Wolfe wave pattern, which carries the potential for a substantial rebound. It’s important to note that this pattern does not signify a definitive trend reversal at this stage.
AUD/USD 4-Hour Chart Analysis
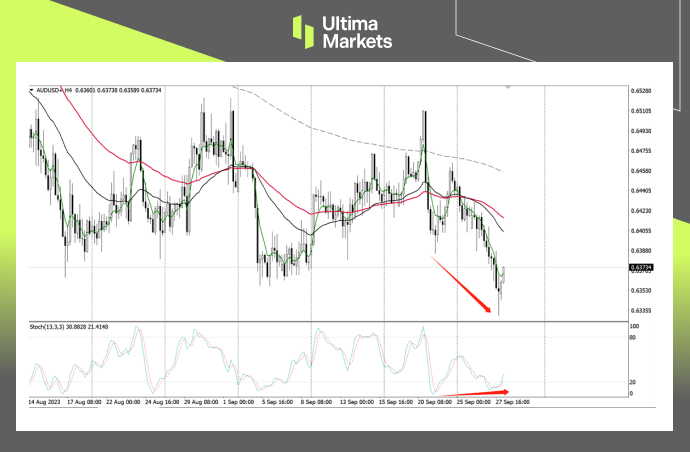
(4-hour chart of AUD/USD, source: Ultima Markets MT4)
Divergence Structure: Transitioning to the 4-hour chart, the price decline led to the formation of a stochastic divergence pattern. This suggests that sellers may find motivation to close their positions and exit at the support level. Observing the influence of the 33-period moving average is crucial.
AUD/USD 1-Hour Chart Analysis
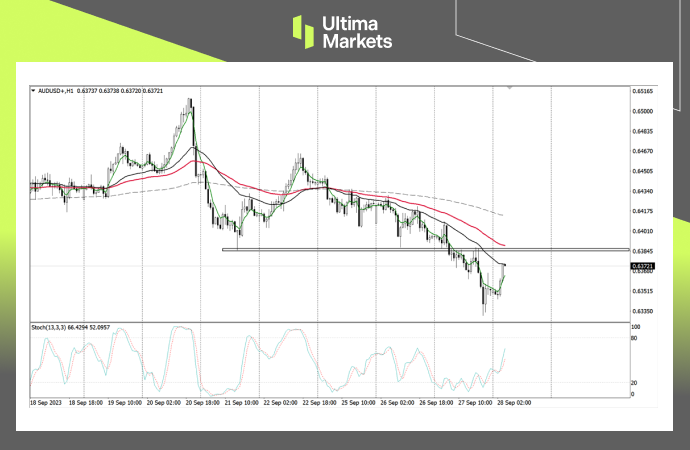
(1-hour chart of AUD/USD, source: Ultima Markets MT4)
Critical Zone: Within the 1-hour timeframe, the area around 0.63853 is a crucial support and resistance conversion zone. This level is also proximate to the 65-period moving average. A potential breakout above this resistance level may pose challenges for the Australian dollar in maintaining its downward trajectory for the day.
Pivot Indicator
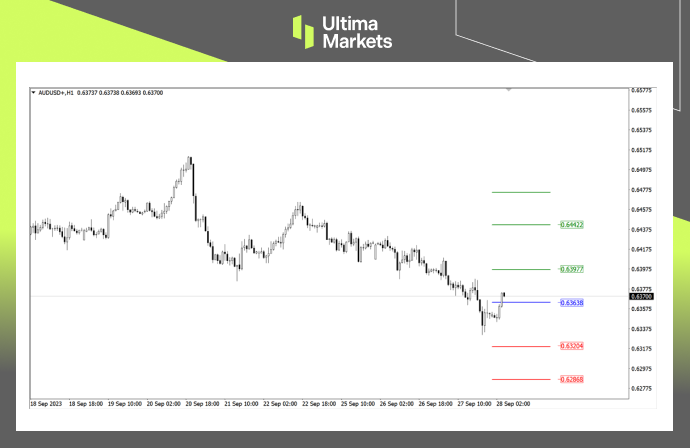
(1-hour chart of AUD/USD, source: Ultima Markets MT4)
Key Price Levels: According to the pivot indicator within Ultima Markets MT4, the central price for the day stands at 0.63638.
- In bullish scenarios above this level, the first target is 0.63977, and the second target extends to 0.64422.
- In bearish scenarios below 0.63638, the first target is 0.63204, with the second target at 0.62868.
Legal Documents
Ultima Markets, a trading name of Ultima Markets Ltd, is authorized and regulated by the Financial Services Commission “FSC” of Mauritius as an Investment Dealer (Full-Service Dealer, excluding Underwriting) (license No. GB 23201593). The registered office address: 2nd Floor, The Catalyst, 40 Silicon Avenue, Ebene Cybercity, 72201, Mauritius.
Disclaimer
Comments, news, research, analysis, price, and all information contained in the article only serve as general information for readers and do not suggest any advice. Ultima Markets has taken reasonable measures to provide up-to-date information, but cannot guarantee accuracy, and may modify without notice. Ultima Markets will not be responsible for any loss incurred due to the application of the information provided.
Copyright © 2023 Ultima Markets Ltd. All rights reserved.
Why Trade Metals & Commodities with Ultima Markets?
Ultima Markets provides the foremost competitive cost and exchange environment for prevalent commodities worldwide.
Start TradingMonitoring the market on the go
Markets are susceptible to changes in supply and demand
Attractive to investors only interested in price speculation
Deep and diverse liquidity with no hidden fees
No dealing desk and no requotes
Fast execution via Equinix NY4 server
FOLLOW US


Ultima Markets is a member of The Financial Commission, an international independent body responsible for resolving disputes in the Forex and CFD markets.
All clients of Ultima Markets are protected under insurance coverage provided by Willis Towers Watson (WTW), a global insurance brokerage established in 1828, with claims eligibility up to US$1,000,000 per account.
Ultima Markets is the first United CFD broker to be part of the United Nations Global Compact.
FOLLOW US
TRADE WITH US
RISK DISCLOSURE
Risk Warning:
Trading leveraged financial products, including Contracts for Difference (CFDs), carries a high level of risk and may result in losses exceeding your initial investment. These products are not suitable for all investors and should only be traded with funds you can afford to lose. You do not own or have any rights to the underlying assets of these derivatives (e.g., entitlement to dividends). Please ensure you fully understand the associated risks. Before trading, consider your level of experience, investment objectives, and seek independent financial advice if necessary. Refer to our legal documents and disclosures before making any trading decisions.
General Advice Warning:
The information provided on this website is general in nature and does not take into account your personal objectives, financial situation, or needs. Before acting on any advice, you should assess its appropriateness in light of your individual circumstances and consult our legal documentation.
Regional Restrictions:
The information and services on this website are not intended for residents of certain jurisdictions, including but not limited to the United States, United Kingdom, Singapore, and any jurisdictions subject to international sanctions. For further information, please contact our customer support team.
Regulatory Information:
Ultima Markets is a trading name shared amongst multiple entities operating in various jurisdictions. These following entities are authorised to operate under the Ultima Markets brand and trademarks.
-
Ultima Markets UK Limited, reference number 470325, is authorised and regulated by the Financial Conduct Authority (FCA). Registered address: 1 Blossom Yard, Fourth Floor, London, E1 6RS, UNITED KINGDOM.
-
Ultima Markets Ltd is authorised and regulated by the Financial Services Commission (FSC) of Mauritius as a Full-Service Investment Dealer (excluding Underwriting), under licence number GB 23201593.
Registered address: 2nd Floor, The Catalyst, 40 Silicon Avenue, Ebene Cybercity, 72201, Mauritius.
-
Ultima Markets EU OÜ, incorporated in Estonia with registry code 17134727. Registered address: Harju maakond, Tallinn, Kristiine linnaosa, Seebi tn 1-1501, 11316. This entity does not offer regulated financial products or provide trading services.
Copyright © 2026 Ultima Markets Ltd. All rights reserved.
-

Messenger


Continue on Messenger
Take the conversation to your Messenger account. You can return anytime.
Scan the QR code and then send the message that appears in your Messenger.
Open Messenger on this device.
-
Instagram
Continue on Instagram
Take the conversation to your Instagram account. You can return anytime.
Scan the QR code to open Instagram. Follow @ultima_markets to send a DM.
Open Instagram on this device.
-
Live Chat
-


