This website is managed by Ultima Markets’ international entities, and it’s important to emphasise that they are not subject to regulation by the FCA in the UK. Therefore, you must understand that you will not have the FCA’s protection when investing through this website – for example:
You will not be guaranteed Negative Balance Protection
You will not be protected by FCA’s leverage restrictions
You will not have the right to settle disputes via the Financial Ombudsman Service (FOS)
You will not be protected by Financial Services Compensation Scheme (FSCS)
Any monies deposited will not be afforded the protection required under the FCA Client Assets Sourcebook. The level of protection for your funds will be determined by the regulations of the relevant local regulator.
Note: UK clients are kindly invited to visit https://www.ultima-markets.co.uk/. Ultima Markets UK expects to begin onboarding UK clients in accordance with FCA regulatory requirements in 2026.
If you would like to proceed and visit this website, you acknowledge and confirm the following:
1.The website is owned by Ultima Markets’ international entities and not by Ultima Markets UK Ltd, which is regulated by the FCA.
2.Ultima Markets Limited, or any of the Ultima Markets international entities, are neither based in the UK nor licensed by the FCA.
3.You are accessing the website at your own initiative and have not been solicited by Ultima Markets Limited in any way.
4.Investing through this website does not grant you the protections provided by the FCA.
5.Should you choose to invest through this website or with any of the international Ultima Markets entities, you will be subject to the rules and regulations of the relevant international regulatory authorities, not the FCA.
Ultima Markets wants to make it clear that we are duly licensed and authorised to offer the services and financial derivative products listed on our website. Individuals accessing this website and registering a trading account do so entirely of their own volition and without prior solicitation.
By confirming your decision to proceed with entering the website, you hereby affirm that this decision was solely initiated by you, and no solicitation has been made by any Ultima Markets entity.
Watch how the Xmaster and XHMaster formula indicators simplify forex trading with clear buy and sell signals on MT4 and MT5 for stronger trading results.
In forex trading, many traders want clarity rather than complexity. The xmaster formula indicator, often shortened to xmaster, is one of the most widely shared custom tools on MetaTrader. With colour-coded cues and arrows, it simplifies market reading and helps identify potential entries and exits without cluttering your charts.
How the Xmaster Formula Indicator Works
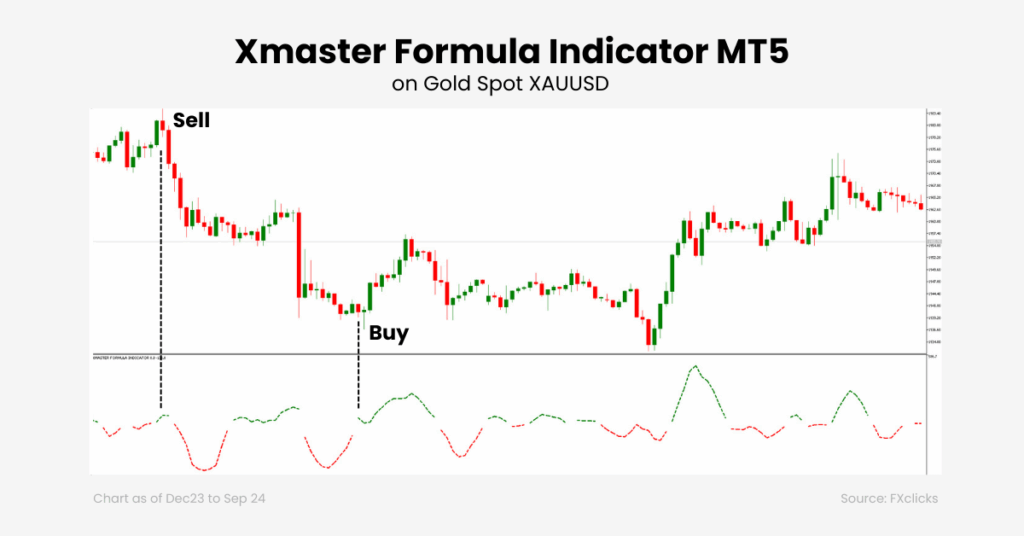
Xmaster combines several popular tools such as moving averages, MACD, RSI, Stochastic, and in some versions Bollinger Bands, into a single visual. In many MT5 builds, it appears in a separate window beneath the price chart.
A green dotted line signals bullish momentum, while a red dotted line reflects bearish momentum. A change in slope or colour highlights a possible turning point, often supported by arrows.
This design doesn’t predict the future; instead, it shows when the balance between buyers and sellers has shifted. Traders use it as a visual prompt, then confirm signals with price structure, moving averages, or other filters.
How To Read Signals
Signals are simple to interpret:
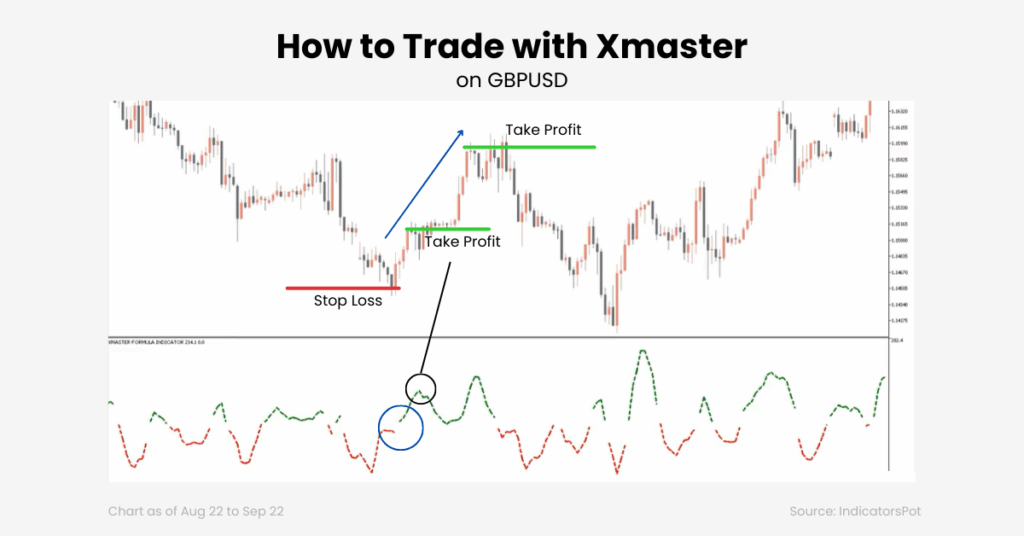
Buy setups form when the green dotted line rises and the candle closes bullish. Stops are typically placed below the latest swing low, and exits occur when the line turns red or a down arrow appears.
Sell setups mirror this logic with the red dotted line sloping downward. Stops sit above the recent swing high, and exits are taken when the line flips green.
Because xmaster is a trend-following tool, it performs best when aligned with higher timeframes. For example, traders may define trend direction on H4 or Daily, then time entries on H1 or M15.
What is XHMaster?
Xmaster has evolved over time into XHMaster in more recent versions. While it retains the same visual structure, these newer builds often feature additional filters, alerts, and adjustable settings. There is no single official version, so behaviour varies by source. Always test the exact file you plan to use before trading live.
History of the Xmaster Formula Indicator (2020–2025)
The Xmaster has existed for over a decade, but between 2020 and 2025 it gained widespread use among retail traders.
2020: The MT4 version became popular for trend-following and breakout strategies on pairs such as EUR/USD and GBP/USD. Free downloads spread quickly across forums.
2021: Traders introduced tweaks aimed at reducing false signals in sideways markets. Interest in an MT5 version began to grow.
2022: MT5 versions circulated more widely, sometimes labelled “xhmaster.” Some traders report backtesting results showing accuracy in the range of 70% to 75% during strong trending conditions, though these figures are anecdotal and depend on the version used.
2023: New builds added visual alerts and sensitivity adjustments, allowing traders to fine-tune settings. Many integrated it into semi-automated Expert Advisors.
2024: Advanced filters were introduced to help control whipsaws in low-volatility markets. The indicator was well-received on higher timeframes such as H4 and Daily.
2025: Latest MT4 and MT5 versions improved customisation and precision. Some developers marketed AI-based filtering, though these remain promotional claims rather than independently verified upgrades.
2026: The XHMaster Formula Indicator continues to be highly relevant in the trading community, offering non-repaint signals and advanced features that align perfectly with both MT4 and MT5 platforms.
No Repaint: A Key Feature
One of xmaster’s key selling points is that it is marketed as no repaint. This means that once a signal appears on a closed candle, it does not change afterwards. This is crucial as repainting can make historical charts look perfect even though live signals would have been inconsistent.
To verify that your version is no repaint:
On MetaTrader, run Strategy Tester in visual mode and watch signals form candle by candle.
On TradingView, use Bar Replay to confirm arrows and lines remain fixed once the candle closes.
If signals change after the fact, use a different version or adapt your approach.
Strengths and Weaknesses of Xmaster
Xmaster’s strength is clarity: it condenses multiple indicators into a clean view. The trade-off is on lag. Like most momentum tools, it can give late or false signals in sideways markets.
Aspect
Strengths
Weaknesses
Visuals
Clear dotted lines and arrows, simple to read
Frequent flips in choppy ranges
Flexibility
Works across forex pairs, gold, indices, and crypto
Needs sensitivity tuning for volatile assets
Setup
Quick installation on MT4 and MT5
Quality varies across versions
Signals
Useful for timing entries in trending markets
Lagging by design and not predictive
Customisation
Adjustable periods, history size, colours, and thickness
Over-tuning may confuse beginners
The key takeaway: xmaster works best in trending conditions with filters in place.
A Practical Trading Approach
A simple way to use xmaster is to combine higher-timeframe bias with lower-timeframe execution.
Suppose H4 shows an uptrend with price above the 200 EMA. On H1, wait for the xmaster line to dip or turn red, signalling a pullback, then rotate back to green with a bullish close. Confirm with RSI above 50 or a breakout above resistance. Place the stop under the latest swing low and take partial profit at 1R. Trail the remainder beneath higher lows until the line turns red or structure breaks.
This approach captures trending moves while limiting losses when conditions change.
Best Practices for Using Xmaster
Before trading live, backtest the indicator to understand win rates and drawdowns, then demo trade at least 30 examples. Combine xmaster with:
A direction filter (EMA or trendline).
A confirmation tool (RSI or MACD).
A volatility check (ATR or Bollinger Bands).
Also align entries with support and resistance to avoid buying into overhead supply or shorting into strong demand.
Installing Xmaster on MetaTrader
Installation is simple. Download the file from a reliable source, open MetaTrader, and go to File → Open Data Folder. Place it into MQL4/MQL5 → Indicators, restart the platform, and drag it from Navigator → Custom Indicators onto your chart.
You can adjust periods, history size, and colours to suit your strategy.
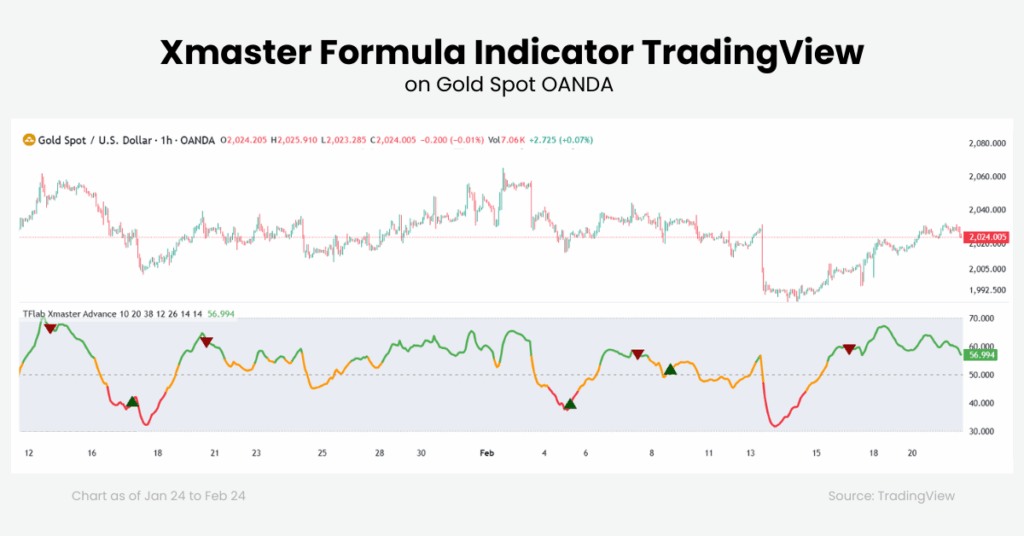
Community versions of xmaster are also available on TradingView, but since they are coded by third parties, features may differ. Always test them with the Replay tool to ensure signals behave consistently before using them live.
Common mistakes to avoid
Trading every colour change without context.
Using it on ultra-short timeframes without testing.
Over-optimising parameters to fit past data.
Ignoring money management.
Conclusion
The xmaster and XHMaster indicators aim to simplify analysis by merging multiple signals into one view. Their greatest strength is clarity, not prediction. When used in the direction of the higher timeframe, confirmed with structure and filtered with simple tools, they can support disciplined trading.
But as with any indicator, the edge comes not from the tool alone but from combining it with risk control, patience, and consistent execution.
FAQ
Do you need a subscription?
No. Most MT4 and MT5 versions are free, although some premium versions may require payment.
Does Xmaster repaint?
It depends on the version. Always test with Strategy Tester or Bar Replay to confirm consistency before using live.
Can it be used on gold or indices?
Yes, Xmaster works across forex, commodities (gold), indices, and crypto. However, it may require sensitivity adjustments for volatile assets.
Disclaimer: This content is provided for informational purposes only and does not constitute, and should not be construed as, financial, investment, or other professional advice. No statement or opinion contained here in should be considered a recommendation by Ultima Markets or the author regarding any specific investment product, strategy, or transaction. Readers are advised not to rely solely on this material when making investment decisions and should seek independent advice where appropriate.
Thank you for visiting the Ultima Markets website. Please note that this website is intended for individuals residing in jurisdictions where access is permitted by law. Ultima and its affiliated entities do not operate in your home jurisdiction.
By clicking ‘Acknowledge’, you confirm that you are entering this website solely on your own initiative and not as a result of any specific marketing outreach. You wish to obtain information from this website based on reverse solicitation principles, in accordance with the applicable laws of your home jurisdiction.