Important Information
This website is managed by Ultima Markets’ international entities, and it’s important to emphasise that they are not subject to regulation by the FCA in the UK. Therefore, you must understand that you will not have the FCA’s protection when investing through this website – for example:
- You will not be guaranteed Negative Balance Protection
- You will not be protected by FCA’s leverage restrictions
- You will not have the right to settle disputes via the Financial Ombudsman Service (FOS)
- You will not be protected by Financial Services Compensation Scheme (FSCS)
- Any monies deposited will not be afforded the protection required under the FCA Client Assets Sourcebook. The level of protection for your funds will be determined by the regulations of the relevant local regulator.
Note: UK clients are kindly invited to visit https://www.ultima-markets.co.uk/. Ultima Markets UK expects to begin onboarding UK clients in accordance with FCA regulatory requirements in 2026.
If you would like to proceed and visit this website, you acknowledge and confirm the following:
- 1.The website is owned by Ultima Markets’ international entities and not by Ultima Markets UK Ltd, which is regulated by the FCA.
- 2.Ultima Markets Limited, or any of the Ultima Markets international entities, are neither based in the UK nor licensed by the FCA.
- 3.You are accessing the website at your own initiative and have not been solicited by Ultima Markets Limited in any way.
- 4.Investing through this website does not grant you the protections provided by the FCA.
- 5.Should you choose to invest through this website or with any of the international Ultima Markets entities, you will be subject to the rules and regulations of the relevant international regulatory authorities, not the FCA.
Ultima Markets wants to make it clear that we are duly licensed and authorised to offer the services and financial derivative products listed on our website. Individuals accessing this website and registering a trading account do so entirely of their own volition and without prior solicitation.
By confirming your decision to proceed with entering the website, you hereby affirm that this decision was solely initiated by you, and no solicitation has been made by any Ultima Markets entity.
I confirm my intention to proceed and enter this website Please direct me to the website operated by Ultima Markets , regulated by the FCA in the United Kingdom
Ultima Markets App
Trade Anytime, Anywhere


In October 2025, the cryptocurrency market experienced a significant crash, driven by a mix of event-triggered liquidations, ETF outflows, rising real yields, dollar fluctuations, and heightened headline risk.
The market plunged by over $370 billion in just hours, with Bitcoin falling to $104,000, Ethereum dipping below $4,000, and altcoins experiencing massive losses of 50–90%.
During the worst trading sessions, over $19 billion in positions were liquidated, while spot crypto ETFs saw hundreds of millions in outflows as investors moved to de-risk.
When Will Bitcoin Crash? Predicting the Next Downturn
While predicting exactly when Bitcoin will crash is difficult, tracking market cycles, sentiment, and economic factors can provide valuable insights into when Bitcoin could be headed for a downturn. Historical patterns show that Bitcoin experiences major corrections or crashes about every 2 to 4 years, often after a period of exponential growth. Here are some key factors to monitor for a potential Bitcoin crash:
Bitcoin’s Market Cycles
Bitcoin follows a cyclical pattern. After reaching a new all-time high, it often experiences a bear market or a significant pullback. These cycles can last anywhere from 18 to 24 months. Based on historical data, Bitcoin could be due for another major correction, as its current price growth has been driven by speculative market behavior.
For example, after Bitcoin reached an all-time high of $69,000 in late 2021, the price plummeted by over 50% in 2022, only to recover later.
Technical Indicators to Watch
Technical analysis provides valuable insights into when a Bitcoin crash might occur. Key indicators such as the Relative Strength Index (RSI), Moving Average Convergence Divergence (MACD), and Bollinger Bands can help identify when Bitcoin is overbought and due for a pullback.
For example, Bitcoin’s RSI recently showed overbought conditions, which may signal that a correction is on the horizon if the price reaches the $100,000 range.
Analysts’ Predictions
Experts frequently provide Bitcoin price forecasts based on both technical analysis and market conditions. Some predict that Bitcoin could drop significantly if certain key support levels are breached.
For example, analyst predictions suggest that Bitcoin may see a 40% crash if it breaks below the $100,000 support level, potentially falling to the $70,000–$80,000 range.
Current October Performance:
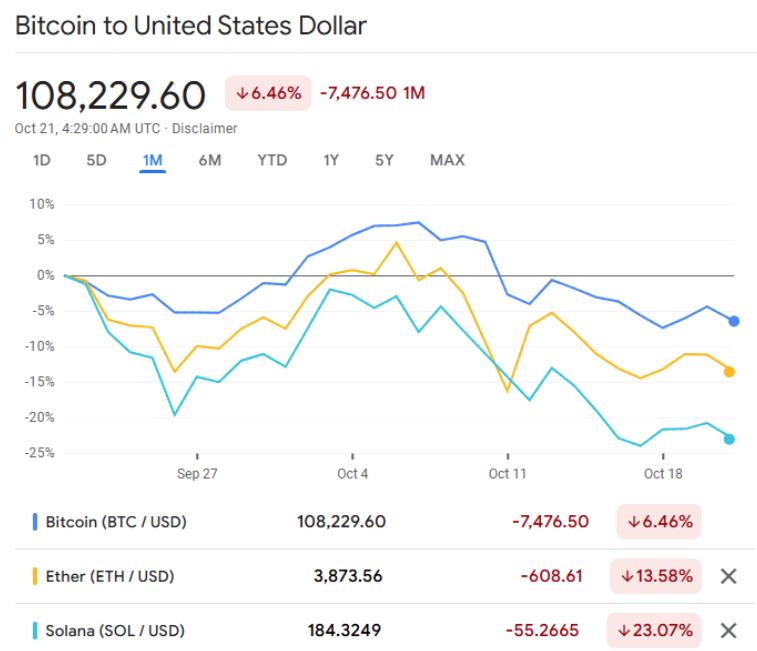
- Bitcoin (BTC/USD) has dropped by 6.46% over the past month, losing $7,476.50 in value. This indicates a significant decline in Bitcoin’s price, which is consistent with a negative trend observed in the price movements of major cryptocurrencies.
- Ether (ETH/USD) has seen a sharper drop of 13.58%, losing $608.61 in the same period. Ether’s performance has been more volatile compared to Bitcoin, as reflected by the steeper downward slope in its price chart.
- Solana (SOL/USD) experienced the most significant drop of 23.07%, losing $55.27. This shows a more extreme decline in Solana’s value relative to Bitcoin and Ether, suggesting that market sentiment for Solana is weaker compared to the other two major cryptocurrencies.
Preceding Factors Leading to the Crash:
- Record Open Interest: Perpetual futures saw open interest nearing $100B.
- Unregulated Meme-Coin Hype: Unchecked speculation in meme coins.
- Overexposure to Yield Farming: Excessive exposure in low-liquidity DeFi protocols.

Why Is Bitcoin Crashing?
Bitcoin has been one of the most talked-about investments due to its massive price swings. So, why is Bitcoin crashing right now? The price of Bitcoin is influenced by various factors, including market sentiment, regulatory concerns, technological advancements, and global economic conditions. Below are the primary drivers behind Bitcoin’s price decline:
Market Sentiment and Speculation
Bitcoin’s price is highly susceptible to market sentiment. Positive news can send its price soaring, while negative news can lead to sharp declines. Speculation plays a significant role, with investors often reacting to short-term market movements or global events.
For example, Bitcoin’s value dropped significantly in June 2021 when news of China’s regulatory crackdowns and cryptocurrency mining bans caused panic selling across the market.
Regulatory Uncertainty
Government regulations remain a significant concern for Bitcoin. Announcements of potential crackdowns or unfavorable regulations can cause sharp declines. Countries like China and India have imposed restrictions that significantly impacted Bitcoin’s price, while ongoing regulatory developments in other parts of the world are closely watched by the market.
For example, when the U.S. Treasury Department signaled it would regulate Bitcoin and other cryptocurrencies in 2025, the market responded with significant sell-offs.
Macroeconomic Factors
Bitcoin often mirrors the trends seen in traditional financial markets. During times of economic uncertainty, Bitcoin can act as a risk-on asset, but also sees declines during broader economic downturns. Economic events such as inflation fears, global recessions, or major geopolitical tensions can lead to Bitcoin price corrections.
For example, during the COVID-19 pandemic, Bitcoin experienced a sharp drop in price but later surged as institutional investors started seeing Bitcoin as a hedge against inflation and traditional market volatility.
Technological Issues and Market Liquidity
Bitcoin’s underlying technology, the blockchain, is continually evolving. Any issues, such as security vulnerabilities or network disruptions, can harm investor confidence, triggering a decline in Bitcoin’s price. Additionally, Bitcoin’s price can be impacted by market liquidity; a lack of liquidity can exacerbate price drops during sell-offs.
For example, the Bitcoin flash crash in May 2025 was caused by a network delay in the blockchain, leading to a significant dip in its value as traders rushed to sell their assets.
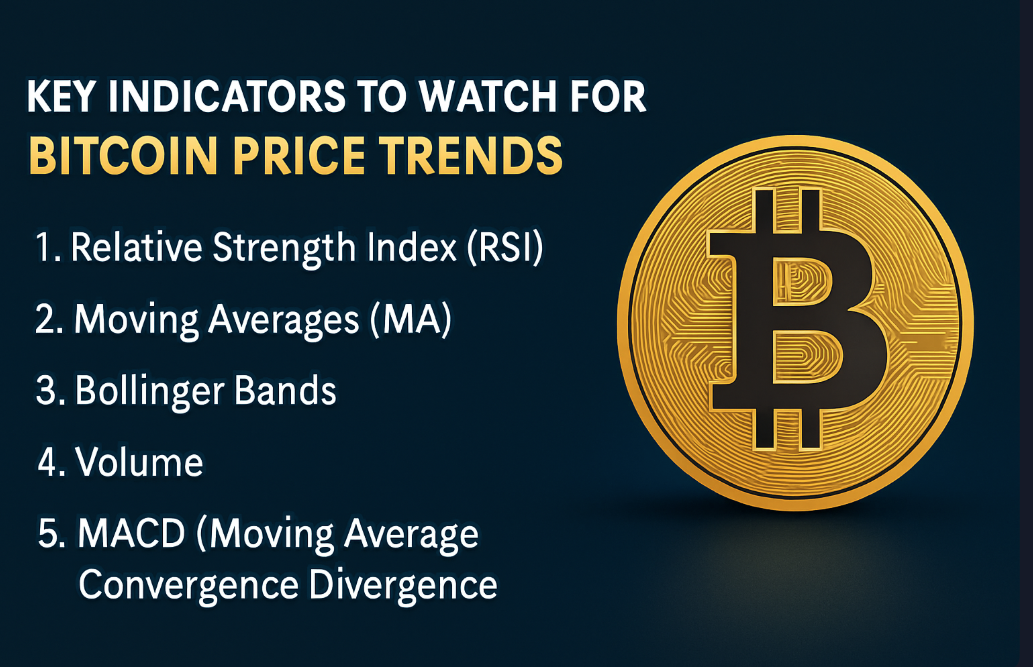
Key Indicators to Watch for Bitcoin Price Trends
To successfully trade Bitcoin and predict price movements, traders rely on a variety of technical indicators and market signals. These indicators help traders assess the strength of a trend, identify potential reversals, and make informed trading decisions. Below are some of the most important indicators to watch for Bitcoin price trends:
Relative Strength Index (RSI)
The RSI is a momentum oscillator that measures the speed and change of price movements. It ranges from 0 to 100, and readings above 70 indicate that Bitcoin is overbought, while readings below 30 suggest it is oversold. Traders use the RSI to spot potential trend reversals or identify whether Bitcoin is in a bullish or bearish condition.
Moving Averages (MA)
Moving Averages are one of the most common indicators in Bitcoin price analysis. The Simple Moving Average (SMA) and Exponential Moving Average (EMA) smooth out price fluctuations and provide a clearer view of the trend.
Bollinger Bands
Bollinger Bands consist of a middle band (SMA), an upper band, and a lower band, which are typically set at 2 standard deviations above and below the middle band. These bands contract during periods of low volatility and expand during periods of high volatility.
Volume
Volume measures the total number of Bitcoin traded during a specific period and can indicate the strength of a price movement. High volume suggests strong interest and supports the validity of a trend, while low volume may indicate that a price move lacks strength.
MACD (Moving Average Convergence Divergence)
The MACD is a trend-following momentum indicator that shows the relationship between two moving averages of Bitcoin’s price: the 12-day EMA and the 26-day EMA. The MACD line is the difference between the two EMAs, while the signal line is the 9-day EMA of the MACD line.
Conclusion
As Bitcoin continues to experience significant price fluctuations, the question on every trader’s mind is: Will Bitcoin crash? While predicting the exact timing of a Bitcoin crash is difficult, understanding the factors that influence Bitcoin trading such as market sentiment, economic conditions, and regulatory developments can provide valuable insights. The volatility of Bitcoin, combined with external events and investor behavior, makes its price movements unpredictable.
However, it’s essential for traders to stay informed and vigilant. By analyzing Bitcoin price trends and using key technical indicators, traders can better anticipate when Bitcoin is going down and adjust their strategies accordingly. Whether Bitcoin is set for a crash or not, maintaining a disciplined approach to Bitcoin trading and managing risk is crucial for success in this volatile market.
Keep an eye on market signals, monitor economic shifts, and use a combination of tools like RSI, MACD, and Bollinger Bands to make informed trading decisions and navigate potential downturns.
Disclaimer: This content is provided for informational purposes only and does not constitute, and should not be construed as, financial, investment, or other professional advice. No statement or opinion contained here in should be considered a recommendation by Ultima Markets or the author regarding any specific investment product, strategy, or transaction. Readers are advised not to rely solely on this material when making investment decisions and should seek independent advice where appropriate.
Latest Articles


FOLLOW US


Ultima Markets is a member of The Financial Commission, an international independent body responsible for resolving disputes in the Forex and CFD markets.
All clients of Ultima Markets are protected under insurance coverage provided by Willis Towers Watson (WTW), a global insurance brokerage established in 1828, with claims eligibility up to US$1,000,000 per account.
Ultima Markets is the first United CFD broker to be part of the United Nations Global Compact.
FOLLOW US
TRADE WITH US
RISK DISCLOSURE
Risk Warning:
Trading leveraged financial products, including Contracts for Difference (CFDs), carries a high level of risk and may result in losses exceeding your initial investment. These products are not suitable for all investors and should only be traded with funds you can afford to lose. You do not own or have any rights to the underlying assets of these derivatives (e.g., entitlement to dividends). Please ensure you fully understand the associated risks. Before trading, consider your level of experience, investment objectives, and seek independent financial advice if necessary. Refer to our legal documents and disclosures before making any trading decisions.
General Advice Warning:
The information provided on this website is general in nature and does not take into account your personal objectives, financial situation, or needs. Before acting on any advice, you should assess its appropriateness in light of your individual circumstances and consult our legal documentation.
Regional Restrictions:
The information and services on this website are not intended for residents of certain jurisdictions, including but not limited to the United States, United Kingdom, Singapore, and any jurisdictions subject to international sanctions. For further information, please contact our customer support team.
Regulatory Information:
Ultima Markets is a trading name shared amongst multiple entities operating in various jurisdictions. These following entities are authorised to operate under the Ultima Markets brand and trademarks.
-
Ultima Markets UK Limited, reference number 470325, is authorised and regulated by the Financial Conduct Authority (FCA). Registered address: 1 Blossom Yard, Fourth Floor, London, E1 6RS, UNITED KINGDOM.
-
Ultima Markets Ltd is authorised and regulated by the Financial Services Commission (FSC) of Mauritius as a Full-Service Investment Dealer (excluding Underwriting), under licence number GB 23201593.
Registered address: 2nd Floor, The Catalyst, 40 Silicon Avenue, Ebene Cybercity, 72201, Mauritius.
Copyright © 2026 Ultima Markets Ltd. All rights reserved.
-

Messenger


Continue on Messenger
Take the conversation to your Messenger account. You can return anytime.
Scan the QR code and then send the message that appears in your Messenger.
Open Messenger on this device.
-

Instagram

Continue on Instagram
Take the conversation to your Instagram account. You can return anytime.
Scan the QR code to open Instagram. Follow @ultima_markets to send a DM.
Open Instagram on this device.
-

Live Chat
-
