
Ultima Markets App
Trade Anytime, Anywhere
Important Information
This website is managed by Ultima Markets’ international entities, and it’s important to emphasise that they are not subject to regulation by the FCA in the UK. Therefore, you must understand that you will not have the FCA’s protection when investing through this website – for example:
- You will not be guaranteed Negative Balance Protection
- You will not be protected by FCA’s leverage restrictions
- You will not have the right to settle disputes via the Financial Ombudsman Service (FOS)
- You will not be protected by Financial Services Compensation Scheme (FSCS)
- Any monies deposited will not be afforded the protection required under the FCA Client Assets Sourcebook. The level of protection for your funds will be determined by the regulations of the relevant local regulator.
Note: Ultima Markets is currently developing a dedicated website for UK clients and expects to onboard UK clients under FCA regulations in 2026.
If you would like to proceed and visit this website, you acknowledge and confirm the following:
- 1.The website is owned by Ultima Markets’ international entities and not by Ultima Markets UK Ltd, which is regulated by the FCA.
- 2.Ultima Markets Limited, or any of the Ultima Markets international entities, are neither based in the UK nor licensed by the FCA.
- 3.You are accessing the website at your own initiative and have not been solicited by Ultima Markets Limited in any way.
- 4.Investing through this website does not grant you the protections provided by the FCA.
- 5.Should you choose to invest through this website or with any of the international Ultima Markets entities, you will be subject to the rules and regulations of the relevant international regulatory authorities, not the FCA.
Ultima Markets wants to make it clear that we are duly licensed and authorised to offer the services and financial derivative products listed on our website. Individuals accessing this website and registering a trading account do so entirely of their own volition and without prior solicitation.
By confirming your decision to proceed with entering the website, you hereby affirm that this decision was solely initiated by you, and no solicitation has been made by any Ultima Markets entity.
I confirm my intention to proceed and enter this website Please direct me to the website operated by Ultima Markets , regulated by the FCA in the United Kingdom

What Is VWAP in Trading? Definition and Strategy Tips
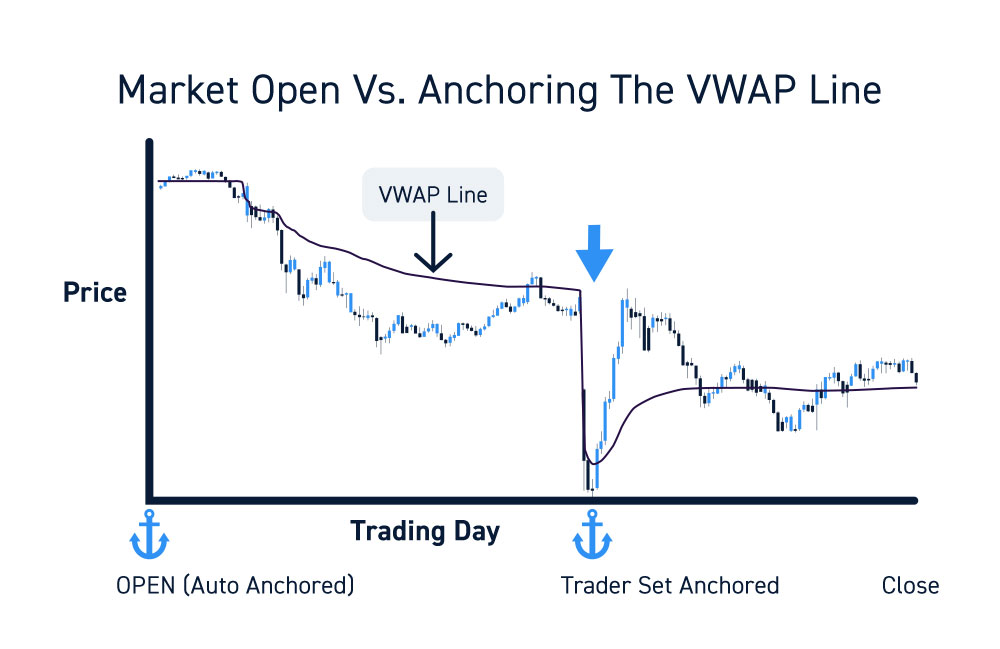
VWAP stands for Volume Weighted Average Price, a technical indicator that reflects the average price value of an asset throughout the trading day, stock weighted by trading volume. VWAP is displayed as a moving average line on intraday charts, helping traders analyze price trends over a specific time frame. It is calculated for each trading day and resets at the market open, making it a daily indicator. VWAP helps traders and investors understand whether a stock is trading above or below its average value during the trading session and is commonly used in stock trading, especially for stocks with high liquidity.
Key Features of VWAP Indicator
- Calculation Basis: Combines price and volume, weighting prices by trading volume.
- Reset Frequency: Resets at the market open each trading day.
- Display: Shown as a moving average line on intraday charts.
- Users: Widely used by institutional investors, institutional traders, institutional buyers, day traders, retail traders, and professional traders.
- Purpose: Assesses trade execution quality, identifies entry/exit points, determines market trends, and reflects stock liquidity.
Why VWAP Important in Trading Industry?
| Purpose | Description |
| Gauge Premium or Discount | Determines if a stock is trading above (premium) or below (discount) its average price. |
| Evaluate Trade Execution | Compares executed prices to VWAP to assess trade quality. |
| Measure Liquidity | Identifies fair value zones by showing where most trading volume occurs. |
| Confirm Technical Signals | Used alongside indicators like RSI or Bollinger Bands for stronger confirmation. |
| Support and Resistance | VWAP line and its upper/lower bands act as dynamic support and resistance levels. |
How VWAP is Calculated?
VWAP calculation uses intraday data and resets each trading day, based on the following steps:
- Calculate Typical Price for Each Interval
- Typical Price = (High + Low + Closing Price) / 3
- Multiply Typical Price by Volume
- Total Value Traded (per interval) = Typical Price × Volume
- Sum Total Values
- Cumulative Total = Sum of (Typical Price × Volume) across intervals
- Sum Volumes
- Total Volume = Sum of Volume across intervals
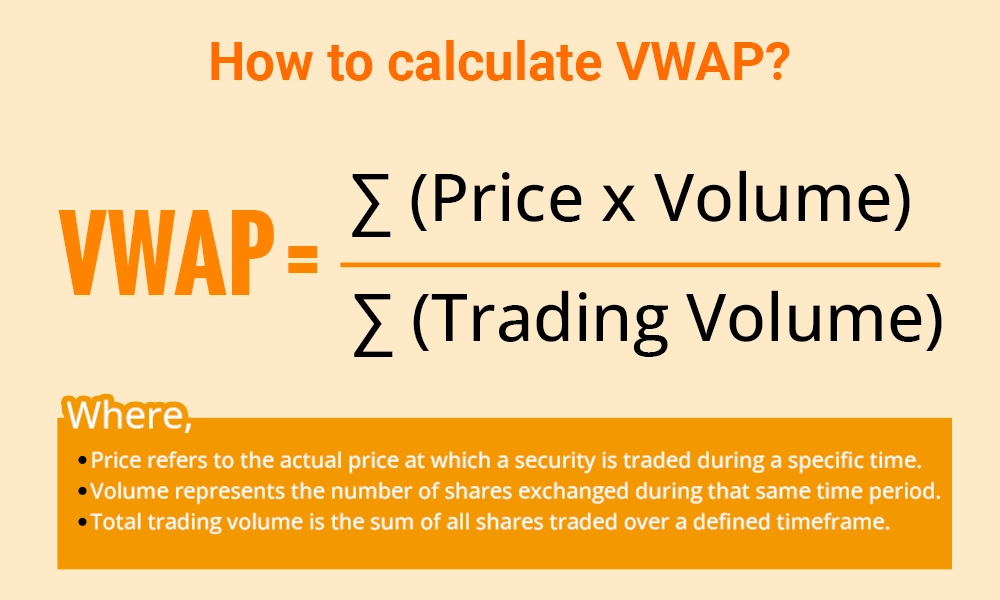
- Apply VWAP Formula
- VWAP = Cumulative Total / Total Volume
Note: Time intervals can vary (e.g., 5-minute, 15-minute) depending on intraday analysis needs.
VWAP Comparing to Other Indicators
| Indicator | Calculation Basis | Purpose/Use |
| VWAP | Price weighted by volume | Reflects average price considering trading volume, ideal for intraday trading and liquidity assessment. |
| Simple Moving Average (SMA) | Average of prices over time | Tracks price trends without volume consideration. |
| Relative Strength Index (RSI) | Measures speed and change of price movements | Identifies overbought or oversold conditions. |
Combining VWAP with other indicators such as RSI or moving averages enhances trading decisions by confirming trends and entry/exit points.
How to Use VWAP in Your Trading Strategy
VWAP can be used alone or combined with other indicators in a trading strategy:
- Trend Validation: Confirm bullish or bearish trends by comparing price to VWAP.
- Entry and Exit Points: Initiate long positions above VWAP anticipating upward moves; take short positions below VWAP anticipating downward trends.
- Track Institutional Activity: Institutional traders use VWAP to minimize market impact and execute large trades efficiently.
- Support/Resistance Levels: Upper and lower VWAP bands indicate overbought or oversold conditions, helping set stop losses and take profits.
VWAP Limitations and When to Be Cautious
- Lagging Indicator: VWAP relies on historical price and volume data, which can delay reaction to sudden market changes.
- Time Period Sensitivity: Different intraday periods or anchor periods affect VWAP interpretation.
- Volume Impact: Large or irregular trades can distort VWAP values.
- Best Use: Most effective in high-volume, liquid markets; less reliable for illiquid stocks or assets.
Conclusion
VWAP is a strategic technical analysis tool that blends price action with volume context. Whether for retail traders or institutional investors, understanding VWAP enhances market insight and improves trade execution decisions.
Disclaimer: This content is provided for informational purposes only and does not constitute, and should not be construed as, financial, investment, or other professional advice. No statement or opinion contained here in should be considered a recommendation by Ultima Markets or the author regarding any specific investment product, strategy, or transaction. Readers are advised not to rely solely on this material when making investment decisions and should seek independent advice where appropriate.
Latest Articles


FOLLOW US


Ultima Markets is a member of The Financial Commission, an international independent body responsible for resolving disputes in the Forex and CFD markets.
All clients of Ultima Markets are protected under insurance coverage provided by Willis Towers Watson (WTW), a global insurance brokerage established in 1828, with claims eligibility up to US$1,000,000 per account.
Ultima Markets is the first United CFD broker to be part of the United Nations Global Compact.
FOLLOW US
TRADE WITH US
RISK DISCLOSURE
Risk Warning:
Trading leveraged financial products, including Contracts for Difference (CFDs), carries a high level of risk and may result in losses exceeding your initial investment. These products are not suitable for all investors and should only be traded with funds you can afford to lose. You do not own or have any rights to the underlying assets of these derivatives (e.g., entitlement to dividends). Please ensure you fully understand the associated risks. Before trading, consider your level of experience, investment objectives, and seek independent financial advice if necessary. Refer to our legal documents and disclosures before making any trading decisions.
General Advice Warning:
The information provided on this website is general in nature and does not take into account your personal objectives, financial situation, or needs. Before acting on any advice, you should assess its appropriateness in light of your individual circumstances and consult our legal documentation.
Regional Restrictions:
The information and services on this website are not intended for residents of certain jurisdictions, including but not limited to the United States, United Kingdom, Singapore, and any jurisdictions subject to international sanctions. For further information, please contact our customer support team.
Regulatory Information:
Ultima Markets is a trading name shared amongst multiple entities operating in various jurisdictions. These following entities are authorised to operate under the Ultima Markets brand and trademarks.
-
Ultima Markets UK Limited, reference number 470325, is authorised and regulated by the Financial Conduct Authority (FCA). Registered address: 1 Blossom Yard, Fourth Floor, London, E1 6RS, UNITED KINGDOM.
-
Ultima Markets Ltd is authorised and regulated by the Financial Services Commission (FSC) of Mauritius as a Full-Service Investment Dealer (excluding Underwriting), under licence number GB 23201593.
Registered address: 2nd Floor, The Catalyst, 40 Silicon Avenue, Ebene Cybercity, 72201, Mauritius.
Copyright © 2026 Ultima Markets Ltd. All rights reserved.
-

Messenger


Continue on Messenger
Take the conversation to your Messenger account. You can return anytime.
Scan the QR code and then send the message that appears in your Messenger.
Open Messenger on this device.
-

Instagram

Continue on Instagram
Take the conversation to your Instagram account. You can return anytime.
Scan the QR code to open Instagram. Follow @ultima_markets to send a DM.
Open Instagram on this device.
-

Live Chat
-
