This website is managed by Ultima Markets’ international entities, and it’s important to emphasise that they are not subject to regulation by the FCA in the UK. Therefore, you must understand that you will not have the FCA’s protection when investing through this website – for example:
You will not be guaranteed Negative Balance Protection
You will not be protected by FCA’s leverage restrictions
You will not have the right to settle disputes via the Financial Ombudsman Service (FOS)
You will not be protected by Financial Services Compensation Scheme (FSCS)
Any monies deposited will not be afforded the protection required under the FCA Client Assets Sourcebook. The level of protection for your funds will be determined by the regulations of the relevant local regulator.
Note: UK clients are kindly invited to visit https://www.ultima-markets.co.uk/. Ultima Markets UK expects to begin onboarding UK clients in accordance with FCA regulatory requirements in 2026.
If you would like to proceed and visit this website, you acknowledge and confirm the following:
1.The website is owned by Ultima Markets’ international entities and not by Ultima Markets UK Ltd, which is regulated by the FCA.
2.Ultima Markets Limited, or any of the Ultima Markets international entities, are neither based in the UK nor licensed by the FCA.
3.You are accessing the website at your own initiative and have not been solicited by Ultima Markets Limited in any way.
4.Investing through this website does not grant you the protections provided by the FCA.
5.Should you choose to invest through this website or with any of the international Ultima Markets entities, you will be subject to the rules and regulations of the relevant international regulatory authorities, not the FCA.
Ultima Markets wants to make it clear that we are duly licensed and authorised to offer the services and financial derivative products listed on our website. Individuals accessing this website and registering a trading account do so entirely of their own volition and without prior solicitation.
By confirming your decision to proceed with entering the website, you hereby affirm that this decision was solely initiated by you, and no solicitation has been made by any Ultima Markets entity.
Learn what the triple bottom pattern is, how it forms, how to confirm the breakout, and how to trade it with simple rules for entries, stops, and targets.
What Is The Triple Bottom Pattern?
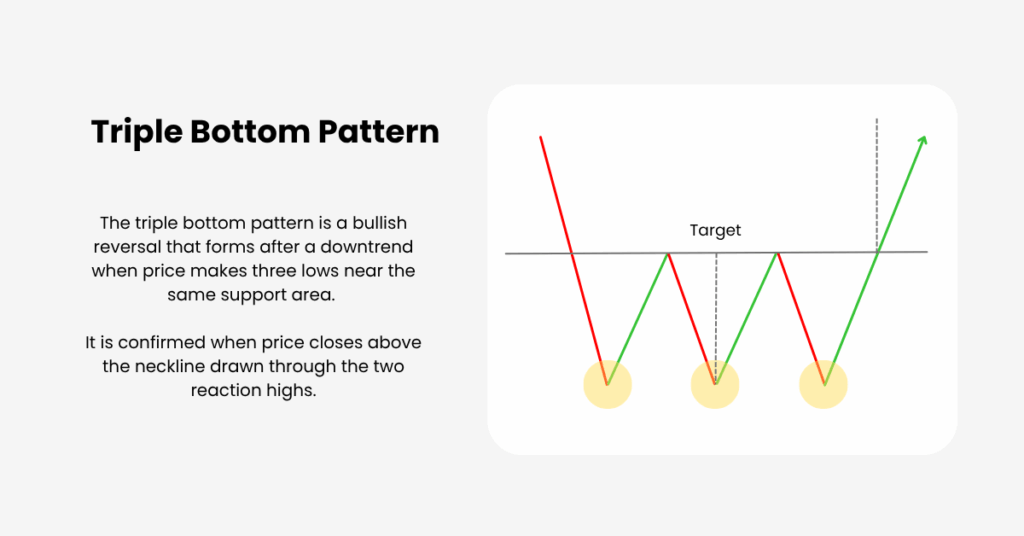
The triple bottom pattern is a bullish reversal setup that forms after a downtrend. Price tests the same support zone three times, fails to break lower, and then closes above neckline resistance. That breakout signals a shift in control from sellers to buyers and sets up a new uptrend.
This article will show you how to identify the triple bottom pattern, confirm it with volume and indicators, and manage entries, stops, and targets with confidence.
How The Triple Bottom Pattern Forms
Understanding the sequence helps you recognise quality from noise.
Preceding Downtrend The pattern carries meaning only after a genuine decline, which creates the conditions for reversal.
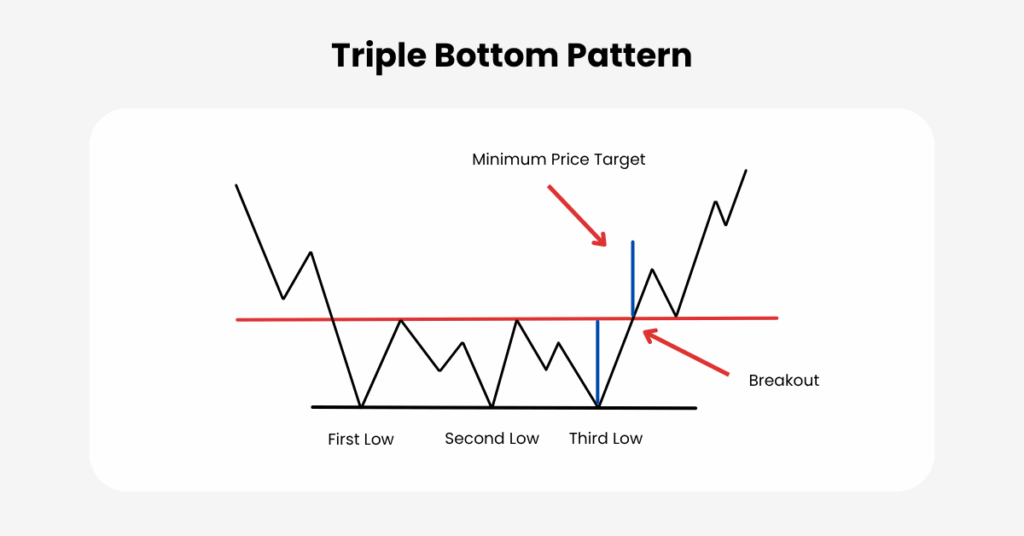
Three Distinct Lows In One Support Area The first low attracts bargain interest, the second low validates demand, and the third low shows supply is fading. Think of a support band rather than a single price.
Two Reaction Highs Create The Neckline The bounces between lows draw a horizontal or gently sloped neckline. This line becomes the confirmation level.
Breakout And Optional Retest A close above the neckline confirms the pattern. A controlled pullback that holds near the neckline often offers a secondary entry. With the structure set, the next question is why this sequence implies a shift in control.
Market Psychology In One Pass
The psychology explains the edge.
At the first low, buyers appear but bears still dominate. The second low shows sellers cannot extend the trend, which strengthens confidence in support. By the third low, short sellers lose conviction and fresh buyers step in. When price closes above the neckline, trapped shorts cover and momentum flips. This narrative sets up the rules for entries, stops, and targets.
Indicator Confirmations That Improve Quality
We now connect price structure to objective tools that confirm strength.
Volume, OBV, VWAP Breakouts with expanding volume are higher quality. Rising On-Balance Volume during the right side of the base signals accumulation. On intraday charts, holding above VWAP after breakout supports buyer control.
MACD A bullish line crossover around the third low or on the breakout aligns momentum with the pattern. A rising histogram from negative toward zero strengthens the case.
RSI A move back above 50 after the breakout is constructive. Bullish RSI divergence at the third low (price equal or lower low while RSI prints a higher low) shows waning downside pressure.
Fibonacci Retracements Map 38.2 percent to 61.8 percent zones inside the base and near the neckline. After breakout, pullbacks into these levels help frame secondary entries and stop placement. With structure and confirms aligned, you can formalise execution.
Trading Rules And Risk Plan
Rules translate the pattern into repeatable decisions.
Entry
Conservative entry on a closing break above the neckline.
Aggressive entry on a successful neckline retest that forms a higher low.
Stop Loss
Classic placement just below the lowest of the three bottoms, with a small buffer such as one ATR.
Tighter variant inside the structure under the most recent swing low to improve reward to risk, accepting a higher chance of being stopped.
Profit Targets
Measured move: distance from the lowest bottom to the neckline projected upward from the breakout.
Consider scaling out at one times risk, then trail below higher swing lows or a rising short-term moving average.
Invalidation
A decisive close back below the neckline after confirmation, or a fresh lower low beneath the third bottom, voids the setup. Before placing orders, compare the triple bottom to similar patterns to avoid mislabels.
Triple Bottom Versus Similar Patterns
Differentiation avoids false assumptions and keeps your rules consistent.
Double Bottom Two lows rather than three. Triple bottoms usually imply stronger base building but occur less frequently.
Inverse Head And Shoulders Three swing lows as well, but the middle low is deeper. Both rely on a neckline break; the choice depends on which geometry the chart truly displays.
Triple Top The bearish mirror image with three highs at resistance and a breakdown trigger. Knowing the opposite helps you read failed reversals faster. With the distinctions clear, the next step is a practical workflow you can apply on any market.
Practical Workflow You Can Repeat
Here is a simple sequence investors can follow to connect scanning, confirmation, and execution.
Scan Look for three separated troughs after a clear downtrend, with a flat or gently sloped neckline that is easy to draw through the two reaction highs.
Validate Confirm accumulation with volume expansion on rallies, rising OBV, MACD turning up or crossing bullish, and RSI back above 50 or showing bullish divergence at the third low.
Plan Risk Set position size, choose a stop just below the lowest trough with a small buffer, and define a measured move target before you place any order.
Execute Enter on a closing breakout above the neckline or on a controlled retest that holds as new support, and place your stop immediately.
Manage Take partial profits around 1R, trail the stop under higher swing lows or a short moving average, and avoid stacking correlated longs that move together.
Conclusion
The triple bottom pattern links a clear price structure to a shift in market psychology. Three tests of support prepare the ground, the neckline defines the moment of confirmation, and indicator evidence helps filter stronger opportunities.
When you combine disciplined entry tactics, protective stops, and measured targets with strict risk control, the pattern becomes a practical framework rather than a chart curiosity. Use the workflow, avoid the common traps, and let only the best-formed bases through your checklist.
Share Now
Disclaimer:This content is provided for informational purposes only and does not constitute, and should not be construed as, financial, investment, or other professional advice. No statement or opinion contained herein should be considered a recommendation by Ultima Markets or the author regarding any specific investment product, strategy, or transaction. Readers are advised not to rely solely on this material when making investment decisions and should seek independent advice where appropriate.
Thank you for visiting the Ultima Markets website. Please note that this website is intended for individuals residing in jurisdictions where access is permitted by law. Ultima and its affiliated entities do not operate in your home jurisdiction.
By clicking ‘Acknowledge’, you confirm that you are entering this website solely on your own initiative and not as a result of any specific marketing outreach. You wish to obtain information from this website based on reverse solicitation principles, in accordance with the applicable laws of your home jurisdiction.