Important Information
This website is managed by Ultima Markets’ international entities, and it’s important to emphasise that they are not subject to regulation by the FCA in the UK. Therefore, you must understand that you will not have the FCA’s protection when investing through this website – for example:
- You will not be guaranteed Negative Balance Protection
- You will not be protected by FCA’s leverage restrictions
- You will not have the right to settle disputes via the Financial Ombudsman Service (FOS)
- You will not be protected by Financial Services Compensation Scheme (FSCS)
- Any monies deposited will not be afforded the protection required under the FCA Client Assets Sourcebook. The level of protection for your funds will be determined by the regulations of the relevant local regulator.
Note: UK clients are kindly invited to visit https://www.ultima-markets.co.uk/. Ultima Markets UK expects to begin onboarding UK clients in accordance with FCA regulatory requirements in 2026.
If you would like to proceed and visit this website, you acknowledge and confirm the following:
- 1.The website is owned by Ultima Markets’ international entities and not by Ultima Markets UK Ltd, which is regulated by the FCA.
- 2.Ultima Markets Limited, or any of the Ultima Markets international entities, are neither based in the UK nor licensed by the FCA.
- 3.You are accessing the website at your own initiative and have not been solicited by Ultima Markets Limited in any way.
- 4.Investing through this website does not grant you the protections provided by the FCA.
- 5.Should you choose to invest through this website or with any of the international Ultima Markets entities, you will be subject to the rules and regulations of the relevant international regulatory authorities, not the FCA.
Ultima Markets wants to make it clear that we are duly licensed and authorised to offer the services and financial derivative products listed on our website. Individuals accessing this website and registering a trading account do so entirely of their own volition and without prior solicitation.
By confirming your decision to proceed with entering the website, you hereby affirm that this decision was solely initiated by you, and no solicitation has been made by any Ultima Markets entity.
I confirm my intention to proceed and enter this website Please direct me to the website operated by Ultima Markets , regulated by the FCA in the United Kingdom
Ultima Markets App
Trade Anytime, Anywhere


What is the Move Index and How to Read It
If you follow markets, you’ve probably heard the move index called the “VIX for bonds.” That shorthand is useful, but it can also leave people with the wrong impression because the move index isn’t predicting whether yields will rise or fall. It’s showing how uncertain the market is about interest rates, based on what Treasury options are pricing in right now.
In this tighter guide, you’ll learn what is the move index, how it’s built, how to translate the number into something practical (basis points per day), and how investors use it as a real-world “stress gauge” for the rates market.
What Is The Move Index?
What is the move index? The move index also known as the ICE BofA MOVE Index measures implied volatility in U.S. Treasury yields using the prices of one-month, over-the-counter options on key Treasury maturities: 2-year, 5-year, 10-year, and 30-year.

It is best viewed as an expectations gauge. Options prices reflect how much movement traders are willing to pay to hedge, which means the move index rises when the market expects larger rate swings.
A key point is that the move index measures the potential size of yield moves, not the direction.
How the Move Index is Calculated
The move index is derived from implied volatility in one-month at-the-money options linked to the current 2Y, 5Y, 10Y, and 30Y Treasuries.
1) It uses one-month, at-the-money Treasury options
The ICE BofA US Bond Market Option Volatility Estimate Index (MOVE) is built from at‑the‑money one‑month options on the current 2Y, 5Y, 10Y, and 30Y Treasuries.
2) It weights the yield curve
The common weighting approach is:
- 20%: 2‑year
- 20%: 5‑year
- 40%: 10‑year
- 20%: 30‑year
That heavier 10‑year weight matters because the 10‑year is a key benchmark rate that anchors many macro narratives and cross-asset valuations.
3) It’s “VIX-like,” but not identical
Academic work from the BIS describes the MOVE index as a yield‑curve‑weighted index of normalised implied volatility on 1‑month Treasury options, constructed in a similar spirit to VIX, but with an important technical difference: MOVE is not model‑free because it’s estimated from at‑the‑money options using the Black (1976) model.
For most readers, the takeaway is simple: the move index is still one of the most widely watched gauges of rate uncertainty, but you shouldn’t assume it behaves exactly like VIX in every circumstance.
How to Read the Move Index
The move index is easiest to interpret when translated into a rough basis-point view of expected daily movement.
The Divide By 16 Rule Of Thumb
In an ICE interview, Harley Bassman explains a practical interpretation: if the move index is at 100, dividing by 16 gives roughly 6, which corresponds to about 6 basis points per day of market‑implied movement (close-to-close) over roughly the next month of trading days.
That means you can do quick mental math:
- move index 50 suggests about 3.1 bps/day
- move index 75 suggests about 4.7 bps/day
- move index 100 suggests about 6.3 bps/day
- move index 150 suggests about 9.4 bps/day
- move index 200 suggests about 12.5 bps/day
This does not forecast tomorrow’s move. It reflects the scale of movement implied by options pricing.
Move Index Levels And What They Signal
The move index does not have a universal “normal” level because volatility changes across market regimes. In general:
- A lower move index suggests the market expects smaller yield swings and has more confidence in the near-term rate path.
- A higher move index suggests the market expects larger yield swings, often when policy, inflation, or liquidity uncertainty rises.
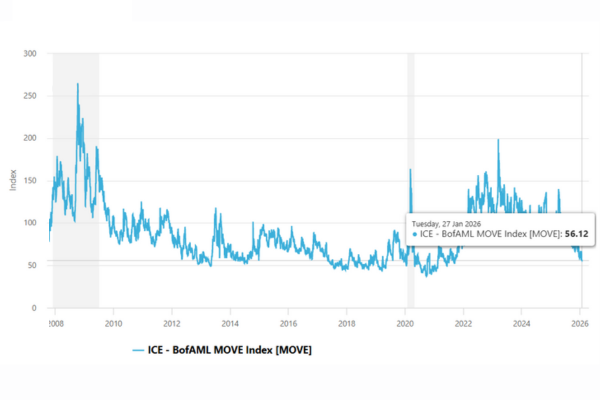
Historical ranges help provide context. TradingView lists an all-time high near 264.6 in October 2008 and an all-time low near 36.6162 in September 2020.
Where The Move Index Is Right Now
As of January 27, 2026, Investing.com shows the move index around 56.12, with a 52-week range of roughly 55.77 to 139.88.
Using the divide-by-16 rule, a move index near 56 implies roughly 3.5 bps/day of market-implied yield movement over the near term.
What Makes the Move Index Jump?
The move index usually rises when traders feel they can’t confidently map the next month of rates. The biggest catalysts tend to be:
Inflation and growth surprises
Hot inflation, weak growth, or unexpected labor-market data can force markets to rapidly reprice the path of policy rates.
Central bank messaging and meeting risk
Because MOVE is based on one‑month options, it’s sensitive to the “next major thing,” like a central bank meeting or a high-impact data release. Bassman specifically notes MOVE is a one‑month window. It is useful, but inherently near term.
Liquidity and “market plumbing”
When liquidity thins out (wide bid-ask spreads, crowded positioning, auction anxiety), yields can gap more aggressively, which can push implied volatility higher.
Stress episodes
In risk-off moments, investors rush to hedge rate exposure, and option prices can jump. This lifts the move index even if yields aren’t moving in a straight line.
Move Index vs VIX
Both the move index and VIX are implied volatility measures derived from options markets. The difference is what they measure:
- VIX reflects implied volatility in U.S. equities.
- The move index reflects implied volatility in U.S. Treasury yields.
They can rise together in stress periods, but they do not always move in sync because equity risk and rate risk can be driven by different forces.
How Investors Use the Move Index
The best way to use the move index is as a context tool:
- Bond portfolio risk checksIf MOVE rises, daily swings in bond prices can become more pronounced, which matters for duration-heavy portfolios.
- Hedging contextHigher implied volatility often means higher option premiums. If the move index is already elevated, hedging may be more expensive.
- Cross-asset awarenessIf equities look calm but the move index is climbing, that can be a sign the market is nervous about rates, even if stock indexes haven’t reacted yet.
Volatility Can Be Calm Right Before it Isn’t
One reason investors track the move index is that low volatility can reflect genuine confidence or complacency. Reuters noted that the MOVE index fell to a four‑year low in early December 2025, highlighting how muted rate volatility had become at that point.
That’s not automatically bullish or bearish. It’s simply a reminder that volatility regimes can shift quickly when macro conditions change.
Conclusion
The move index is one of the clearest “at a glance” indicators of stress (or calm) in the U.S. rates market. If you remember just two things, make it these: the move index measures expected movement, not direction, and dividing by ~16 can help translate the level into a practical basis-points-per-day intuition.
FAQ
The move index is a single number that summarises how volatile the market expects U.S. Treasury yields to be over the near term, based on one‑month options pricing across key maturities.
A high move index means the market is pricing larger yield swings (higher uncertainty), often around inflation shocks, policy surprises, or liquidity stress.
Rule of thumb: 100 ÷ 16 ≈ ~6, or about 6 bps/day of market‑implied yield movement over the next month.
Disclaimer: This content is provided for informational purposes only and does not constitute, and should not be construed as, financial, investment, or other professional advice. No statement or opinion contained here in should be considered a recommendation by Ultima Markets or the author regarding any specific investment product, strategy, or transaction. Readers are advised not to rely solely on this material when making investment decisions and should seek independent advice where appropriate.
Latest Articles


FOLLOW US


Ultima Markets is a member of The Financial Commission, an international independent body responsible for resolving disputes in the Forex and CFD markets.
All clients of Ultima Markets are protected under insurance coverage provided by Willis Towers Watson (WTW), a global insurance brokerage established in 1828, with claims eligibility up to US$1,000,000 per account.
Ultima Markets is the first United CFD broker to be part of the United Nations Global Compact.
FOLLOW US
TRADE WITH US
RISK DISCLOSURE
Risk Warning:
Trading leveraged financial products, including Contracts for Difference (CFDs), carries a high level of risk and may result in losses exceeding your initial investment. These products are not suitable for all investors and should only be traded with funds you can afford to lose. You do not own or have any rights to the underlying assets of these derivatives (e.g., entitlement to dividends). Please ensure you fully understand the associated risks. Before trading, consider your level of experience, investment objectives, and seek independent financial advice if necessary. Refer to our legal documents and disclosures before making any trading decisions.
General Advice Warning:
The information provided on this website is general in nature and does not take into account your personal objectives, financial situation, or needs. Before acting on any advice, you should assess its appropriateness in light of your individual circumstances and consult our legal documentation.
Regional Restrictions:
The information and services on this website are not intended for residents of certain jurisdictions, including but not limited to the United States, United Kingdom, Singapore, and any jurisdictions subject to international sanctions. For further information, please contact our customer support team.
Regulatory Information:
Ultima Markets is a trading name shared amongst multiple entities operating in various jurisdictions. These following entities are authorised to operate under the Ultima Markets brand and trademarks.
-
Ultima Markets UK Limited, reference number 470325, is authorised and regulated by the Financial Conduct Authority (FCA). Registered address: 1 Blossom Yard, Fourth Floor, London, E1 6RS, UNITED KINGDOM.
-
Ultima Markets Ltd is authorised and regulated by the Financial Services Commission (FSC) of Mauritius as a Full-Service Investment Dealer (excluding Underwriting), under licence number GB 23201593.
Registered address: 2nd Floor, The Catalyst, 40 Silicon Avenue, Ebene Cybercity, 72201, Mauritius.
Copyright © 2026 Ultima Markets Ltd. All rights reserved.
-

Messenger


Continue on Messenger
Take the conversation to your Messenger account. You can return anytime.
Scan the QR code and then send the message that appears in your Messenger.
Open Messenger on this device.
-

Instagram

Continue on Instagram
Take the conversation to your Instagram account. You can return anytime.
Scan the QR code to open Instagram. Follow @ultima_markets to send a DM.
Open Instagram on this device.
-

Live Chat
-
