This website is managed by Ultima Markets’ international entities, and it’s important to emphasise that they are not subject to regulation by the FCA in the UK. Therefore, you must understand that you will not have the FCA’s protection when investing through this website – for example:
You will not be guaranteed Negative Balance Protection
You will not be protected by FCA’s leverage restrictions
You will not have the right to settle disputes via the Financial Ombudsman Service (FOS)
You will not be protected by Financial Services Compensation Scheme (FSCS)
Any monies deposited will not be afforded the protection required under the FCA Client Assets Sourcebook. The level of protection for your funds will be determined by the regulations of the relevant local regulator.
Note: UK clients are kindly invited to visit https://www.ultima-markets.co.uk/. Ultima Markets UK expects to begin onboarding UK clients in accordance with FCA regulatory requirements in 2026.
If you would like to proceed and visit this website, you acknowledge and confirm the following:
1.The website is owned by Ultima Markets’ international entities and not by Ultima Markets UK Ltd, which is regulated by the FCA.
2.Ultima Markets Limited, or any of the Ultima Markets international entities, are neither based in the UK nor licensed by the FCA.
3.You are accessing the website at your own initiative and have not been solicited by Ultima Markets Limited in any way.
4.Investing through this website does not grant you the protections provided by the FCA.
5.Should you choose to invest through this website or with any of the international Ultima Markets entities, you will be subject to the rules and regulations of the relevant international regulatory authorities, not the FCA.
Ultima Markets wants to make it clear that we are duly licensed and authorised to offer the services and financial derivative products listed on our website. Individuals accessing this website and registering a trading account do so entirely of their own volition and without prior solicitation.
By confirming your decision to proceed with entering the website, you hereby affirm that this decision was solely initiated by you, and no solicitation has been made by any Ultima Markets entity.
Discover what the Bart Simpson pattern is, how to spot it on live crypto charts in 2025, and what it means for your trading strategy and risk management.
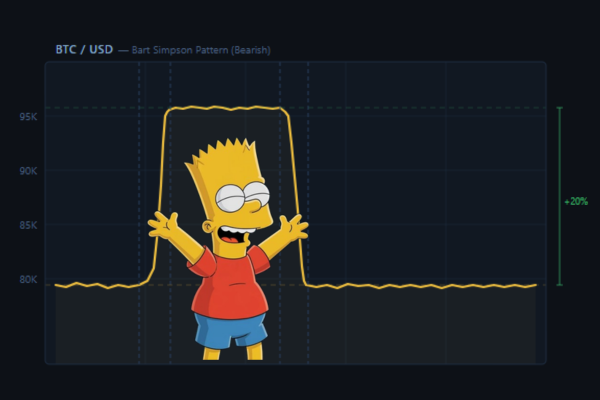
If you have spent any time watching crypto price charts, you have likely come across a formation that looks strangely familiar. Price consolidates quietly, spikes sharply in one direction, moves sideways at the new level, then reverses entirely back to where it started. That is the bart simpson pattern, and it has become one of the most recognised and most debated formations in cryptocurrency trading.
Named after the spiky hairstyle of the iconic animated character, the pattern describes a price sequence where an asset surges or drops sharply, consolidates, then reverses back to the origin point. It is not a traditional technical analysis pattern like a head and shoulders or double bottom.
It evolved from trader slang and crypto charting communities, and it has earned its place in the active trader’s vocabulary for one reason: it appears constantly, and it consistently punishes leveraged positions on both sides.
Where Did It Come From?
The bart simpson pattern first emerged during the 2018 Bitcoin bear market, when trading volume and liquidity declined sharply as broader interest in crypto faded. Those low-liquidity conditions created the ideal environment for sudden, reversible price distortions to repeat across charts.
Two theories explain its formation. The first draws on the Wyckoff price cycle, where markets move through accumulation, markup, distribution and markdown. In compressed timeframes, the bart simpson pattern closely mirrors this cycle. The second theory points to deliberate manipulation, where large players exploit thin order books to push price into stop-loss clusters before reversing. In most real-world cases, both forces are at work simultaneously.
The Two Variants: Bearish and Bullish
Bearish Bart
The bearish or classic form begins with a rapid price increase, followed by sideways consolidation at the higher level, then a sharp decline back to previous levels. The shape traces the outline of Bart Simpson’s spiky hair going upward then returning flat.
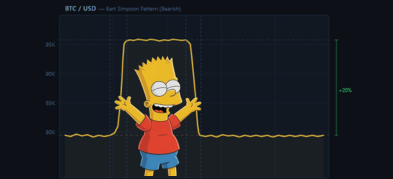
Bullish Bart
The bullish or inverse form is the mirror image. Price drops sharply, consolidates at the lower level, then recovers back to the original range. Both variants follow the same structural logic of spike, plateau and reversal. Identifying which is forming early gives traders a clearer basis for deciding whether to reduce exposure or look for a fade opportunity.
Why Does It Keep Happening?
The pattern thrives in low-liquidity environments where smaller trades can disproportionately move price. Several factors drive this cycle.
Liquidation Cascades
A sharp price move triggers stop-loss orders on leveraged positions, fuelling the spike further. Once those liquidations are absorbed, price snaps back. According to Coinglass data, more than $140 million in Bitcoin long positions were liquidated within a single hour during one such episode, with the broader market seeing over $400 million in leveraged liquidations within 24 hours.
Whale Activity
High-frequency trading firms and large investors have been accused of engineering sharp price moves to trigger retail stop-loss orders, then reaccumulating positions at more favourable levels once weaker hands are flushed out.
Low-Volume Windows
Weekends, late-night sessions and public holidays are where the bart simpson pattern clusters most frequently. Fewer active participants mean less resistance to outsized moves, making these periods disproportionately risky for leveraged traders.
Macro Conditions in 2025
As Bitcoin’s correlation with equities has strengthened this year, events such as Federal Reserve policy shifts and sudden equity sell-offs have created feedback loops that amplify intraday volatility. A tariff-related shock earlier in 2025 triggered over $19 billion in crypto liquidations in a single session, producing multiple Bart formations across major trading pairs.
2025: The Pattern in Action
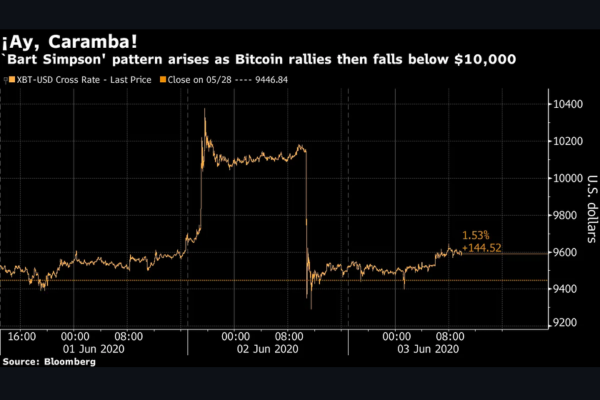
In December 2025, Bitcoin slipped below $90,000 over the weekend as volatility intensified. Analysts documented three distinct bart simpson pattern formations between 10 and 12 December alone, with others identifying five or more cases from late November through to mid-December. One notable episode returned Bitcoin’s price to $85,500 following a failed rally attempt.
Image Source: Bloomberg
Analyst Paweł Łaskarzewski summarised the conditions plainly: “Bart pattern combined with weekend order books creates stop-loss hunts. My base case is both sides get wiped before a clear trend emerges.”
It is also worth noting that December’s reputation as a bullish month for Bitcoin masks a more complicated picture. Historical data shows a 4.8% average gain for the month, but a negative median decline of 3.2%, with seven negative Decembers in the last twelve years. Seasonal optimism alone does not cancel out the structural risks this pattern creates.
How to Identify It in Real Time
Volume and RSI
The spike phase typically arrives with a sudden surge in trading activity, while the plateau and reversal both occur on declining volume. When volume fades at the new price level, it signals that the move lacks genuine conviction.
RSI divergence offers secondary confirmation: if price holds a new level after the spike but RSI begins reverting toward neutral from overbought or oversold territory, a snap-back becomes more probable.
Timeframes to Watch
The pattern is most visible on short timeframes, from 15 minutes to a few hours, though it has also appeared on daily charts during major market events. Cross-referencing with the 4H or daily chart helps confirm whether a spike is an isolated move or part of a broader trend.
The False Bart
Not every pattern completes as expected. Consolidations can break in unexpected directions, trapping traders who assumed the reversal was coming. Waiting for clear confirmation before acting is always the more disciplined approach.
Limitations to Keep in Mind
The bart simpson pattern carries real limitations. The first is subjectivity: what looks like a Bart to one trader may look like ordinary noise to another, particularly on faster timeframes. Unlike classical patterns, it has no long-established academic origin and lacks broad statistical validation through backtesting.
The second concern is false signals. The consolidation phase does not guarantee a reversal in any specific direction, and acting too early can result in a poorly timed entry. These limitations reinforce why the pattern should always be used alongside other indicators rather than as a standalone trigger.
How to Trade Around It
Avoid Chasing the Spike
If a sharp vertical move occurs without a clear news catalyst, entering in the direction of the spike is rarely justified. The reversal risk is too high without further confirmation from volume or RSI.
Fading the Plateau
If you are considering a fade trade, wait for the plateau to form fully and for volume to dry up before entering. When placing your stop, position it beyond the outer boundary of the consolidated flat segment rather than within it. Stops placed inside the range are far more vulnerable to the same liquidity events that created the pattern.
Manage Leverage on Weekends
Reduce leverage during low-volume windows. The bart simpson pattern is most damaging to traders holding high-leverage positions over weekends or during thin sessions. Keeping position sizes conservative during these periods is one of the simplest ways to limit exposure.
Conclusion
The bart simpson pattern is more than a novelty named after a cartoon character. It is a real and recurring feature of crypto markets, rooted in thin liquidity, leveraged liquidations and the calculated behaviour of large players.
While it carries limitations and should never be used in isolation, understanding how and why it forms gives traders a meaningful edge when navigating volatile conditions.
For traders on platforms like Ultima Markets, recognising this pattern is a practical part of managing risk in a market that does not always behave the way the textbooks suggest.
FAQs
Is the Bart Simpson pattern only found in crypto markets?
It is most common in crypto, but it can appear in any low-liquidity speculative market. Leverage and thin order books make crypto the most frequent breeding ground.
What is the difference between the bearish and bullish Bart Simpson pattern?
The bearish form spikes up, consolidates, then drops back down. The bullish form is the inverse: drops, consolidates, then recovers. The direction of the initial spike tells you which variant you are dealing with.
Why does price always return to where it started?
The spike is driven by liquidations or stop-hunts rather than genuine demand. Once those positions are cleared, there is nothing to hold price at the new level and it reverts to equilibrium.
Disclaimer: This content is provided for informational purposes only and does not constitute, and should not be construed as, financial, investment, or other professional advice. No statement or opinion contained here in should be considered a recommendation by Ultima Markets or the author regarding any specific investment product, strategy, or transaction. Readers are advised not to rely solely on this material when making investment decisions and should seek independent advice where appropriate.
Thank you for visiting the Ultima Markets website. Please note that this website is intended for individuals residing in jurisdictions where accessing is permitted by law. Ultima and its affiliated entities do not operate in your home jurisdictions.
By clicking on ''Acknowledge'', you confirm that you are entering this website solely based on your initiative and not as a result of any specific marketing outreach. You wish to obtain information from this website based on reverse solicitation principles, in accordance with the applicable laws of your home jurisdiction.