
Ultima Markets App
Trade Anytime, Anywhere
Important Information
This website is managed by Ultima Markets’ international entities, and it’s important to emphasise that they are not subject to regulation by the FCA in the UK. Therefore, you must understand that you will not have the FCA’s protection when investing through this website – for example:
- You will not be guaranteed Negative Balance Protection
- You will not be protected by FCA’s leverage restrictions
- You will not have the right to settle disputes via the Financial Ombudsman Service (FOS)
- You will not be protected by Financial Services Compensation Scheme (FSCS)
- Any monies deposited will not be afforded the protection required under the FCA Client Assets Sourcebook. The level of protection for your funds will be determined by the regulations of the relevant local regulator.
Note: Ultima Markets is currently developing a dedicated website for UK clients and expects to onboard UK clients under FCA regulations in 2026.
If you would like to proceed and visit this website, you acknowledge and confirm the following:
- 1.The website is owned by Ultima Markets’ international entities and not by Ultima Markets UK Ltd, which is regulated by the FCA.
- 2.Ultima Markets Limited, or any of the Ultima Markets international entities, are neither based in the UK nor licensed by the FCA.
- 3.You are accessing the website at your own initiative and have not been solicited by Ultima Markets Limited in any way.
- 4.Investing through this website does not grant you the protections provided by the FCA.
- 5.Should you choose to invest through this website or with any of the international Ultima Markets entities, you will be subject to the rules and regulations of the relevant international regulatory authorities, not the FCA.
Ultima Markets wants to make it clear that we are duly licensed and authorised to offer the services and financial derivative products listed on our website. Individuals accessing this website and registering a trading account do so entirely of their own volition and without prior solicitation.
By confirming your decision to proceed with entering the website, you hereby affirm that this decision was solely initiated by you, and no solicitation has been made by any Ultima Markets entity.
I confirm my intention to proceed and enter this website Please direct me to the website operated by Ultima Markets , regulated by the FCA in the United Kingdom

What is PPI? How to Use the Producer Price Index to Forecast Market Trends
PPI, as a “leading indicator of inflation,” holds predictive value for future changes in consumer prices by reflecting production cost pressures in advance. It has a crucial influence on central banks’ interest rate policy adjustments and inflation expectation management, while also directly affecting currency trends, making it a key reference for forex traders and investors to assess market direction.
This article will provide an in-depth explanation of what PPI is, how it is calculated, its relevance to the market, as well as the latest data and future trends, helping investors grasp market dynamics and optimize investment strategies.
What Is PPI?
The Producer Price Index (PPI) is a key economic indicator that measures price changes for goods and services at the production level. It reflects changes in costs faced by producers during the production process, offering forward-looking insight into inflation trends.
According to the U.S. Bureau of Labor Statistics (BLS), PPI tracks the average change in selling prices received by domestic producers for their output. These data cover a wide range of goods and services—from raw materials to finished products—offering deep insight into the overall economic health.
For investors, understanding PPI fluctuations can help forecast future inflationary pressure and thus influence investment decisions. For example, a rise in PPI may signal an upcoming increase in the Consumer Price Index (CPI), which could impact central bank monetary policy.
How Is PPI Calculated and Where Does the Data Come From?
PPI is published monthly by the U.S. Bureau of Labor Statistics, with data collected from producer surveys across the country. These data cover price movements of over 10,000 goods and services and are categorized by different industries and product types.
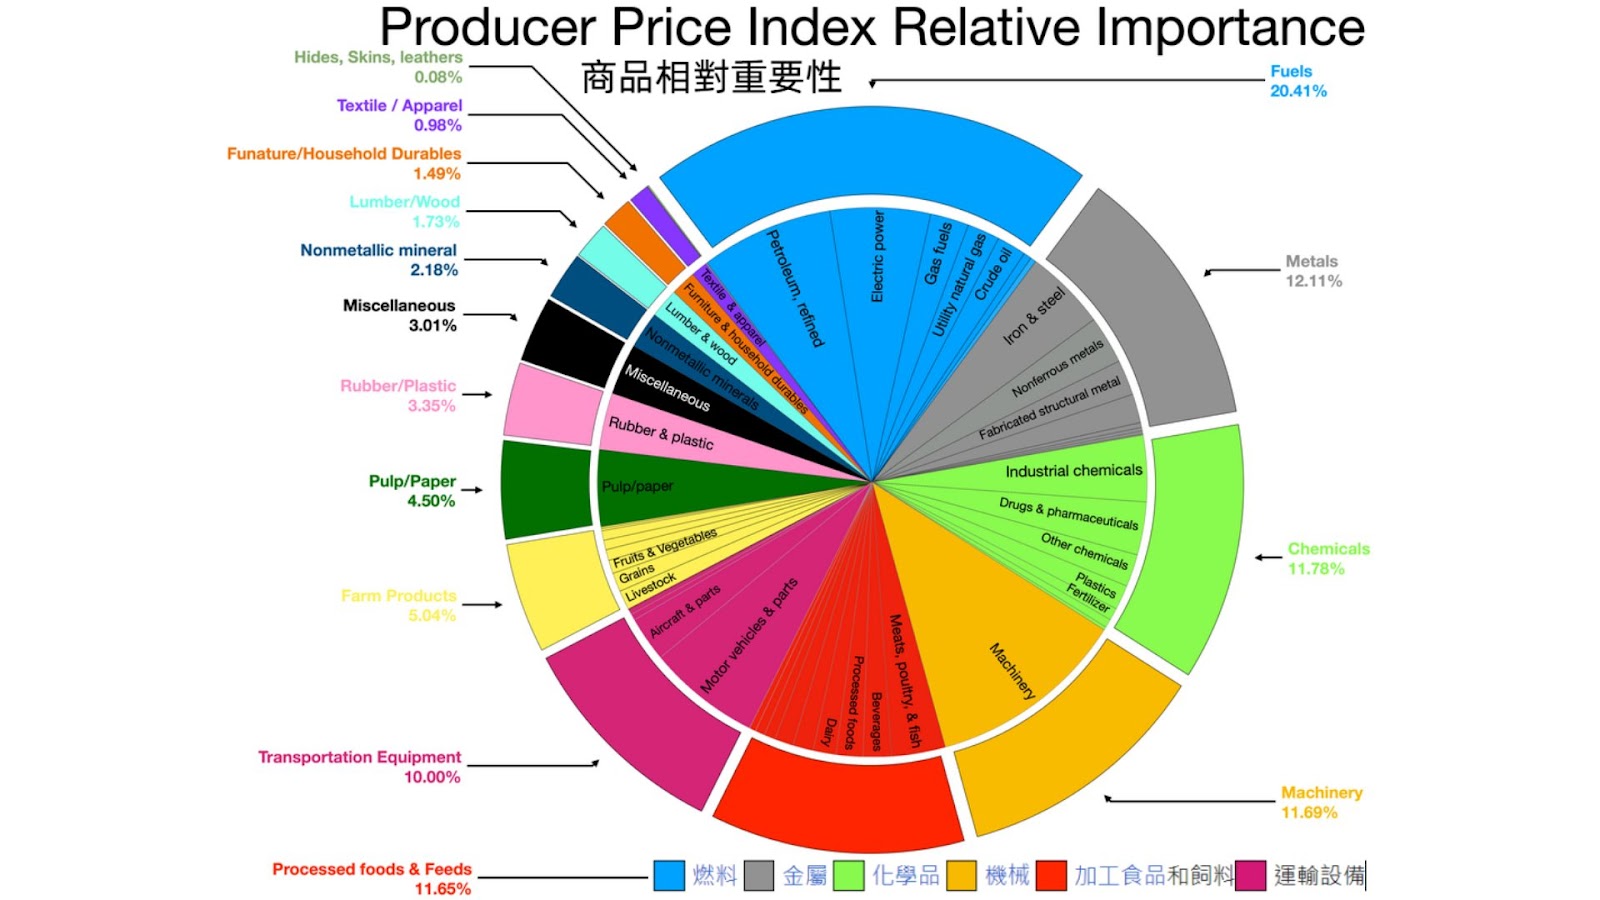
In calculating the PPI, the BLS takes various factors into account, including selling prices of goods and service charges. These data are weighted to reflect the relative importance of different goods and services within the overall economy.
It is important to note that PPI data exclude import prices and focus solely on domestic producer price changes, making it a crucial indicator for monitoring shifts in domestic production costs.
Differences Between PPI and CPI: What Investors Must Know
Both PPI and CPI are indicators used to measure price changes, but they differ in terms of focus and application.
- PPI (Producer Price Index): Reflects cost changes faced by producers during the production of goods and services.
- CPI (Consumer Price Index): Measures price changes that consumers pay when purchasing goods and services.
Their differences can be summarized in the table below:
| Dimension | PPI (Producer Price Index) | CPI (Consumer Price Index) |
| Monitoring Focus | Factory/Purchase prices in the industrial sector | End-consumer prices for goods and services |
| Timing | Leading indicator (predicts CPI 3–6 months ahead) | Lagging indicator |
| Impact on Forex | Indirect (via interest rate expectations) | Direct (central banks anchor inflation targets to CPI) |
| Volatility | High (sensitive to commodity price shocks) | More stable |
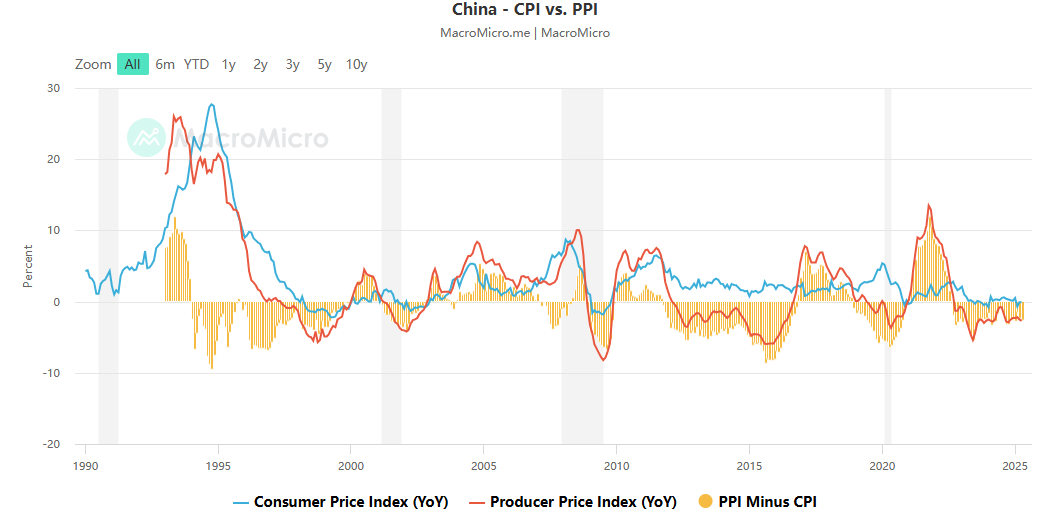
In short, PPI focuses on price changes at the production end, while CPI focuses on price changes at the consumption end. Since changes in production costs eventually affect consumer prices, PPI is often regarded as a leading indicator of CPI.
For investors, understanding the relationship between PPI and CPI helps forecast inflation trends and formulate appropriate investment strategies.
How PPI Impacts the Market
Changes in PPI have profound effects on financial markets.
Impact of PPI on Inflation Expectations
An increase in PPI usually signals rising production costs for businesses, which may eventually be passed on to consumers, pushing up CPI and creating inflationary pressure. The market may then anticipate inflation ahead of time and adjust portfolios and hedging strategies accordingly. Conversely, a weaker PPI may lead the market to expect slower inflation and reduced concern over price increases.
Impact of PPI on Interest Rate Decisions
Central banks closely monitor PPI data, as it is a key reference for adjusting interest rate policy. When PPI is elevated, central banks may accelerate rate hikes to curb inflation and tighten liquidity; if PPI is weak, rate cuts may be implemented to stimulate the economy. The direction of interest rates directly affects the bond, equity, and forex markets.
Impact of PPI on Currency Movements
PPI fluctuations can trigger currency market volatility. A higher PPI strengthens market expectations of rate hikes, boosting the currency’s exchange rate; conversely, a weak PPI may drag down currency value. For forex traders, interpreting PPI trends helps in capturing both short- and medium-term movements in major currency pairs such as EUR/USD and USD/JPY.
Impact of PPI on the Stock and Commodity Markets
A high PPI may squeeze corporate profit margins, weighing on stock performance—particularly in manufacturing and retail sectors—while benefiting commodity suppliers such as energy and metal industries. In the commodity market, a rising PPI indicates stronger commodity prices, attracting investors to increase allocations to gold, oil, and other assets.
For investors, understanding the links between PPI, inflation, and interest rates helps forecast market trends and formulate appropriate investment strategies.
PPI Release Schedule and Market Forecast for 2025
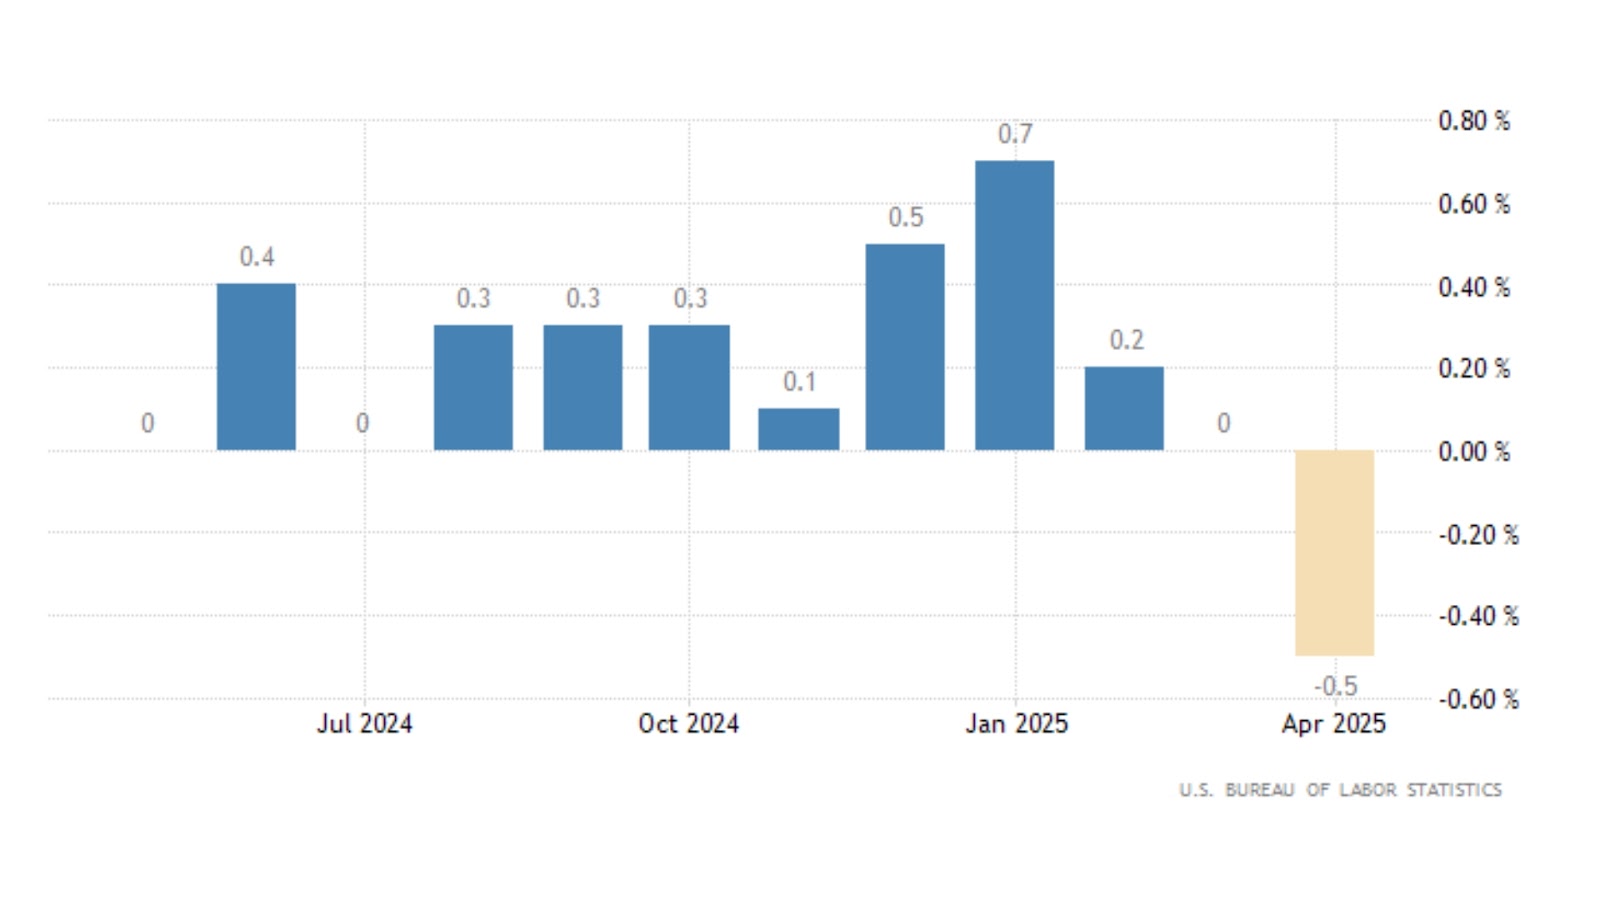
The Producer Price Index (PPI) is compiled and published monthly by the U.S. Bureau of Labor Statistics (BLS), reflecting data for the previous month. Below is the latest data for the U.S. PPI in 2025 compiled as follows:
| Release Date | Time | Actual | Forecast | Previous |
| May 15, 2025 (Apr) | 20:30 | -0.5% | 0.2% | 0.0% |
| April 11, 2025 (Mar) | 20:30 | -0.4% | 0.2% | 0.1% |
| March 13, 2025 (Feb) | 20:30 | 0.0% | 0.3% | 0.6% |
| February 13, 2025 (Jan) | 21:30 | 0.4% | 0.3% | 0.5% |
| January 14, 2025 (Dec) | 21:30 | 0.2% | 0.4% | 0.4% |
According to the latest data, the PPI for April 2025 increased by 2.4% year-on-year, lower than the market forecast of 2.5%; on a month-over-month basis, it declined by 0.5%, indicating easing inflationary pressure.
Based on the release schedule, the upcoming PPI release dates for the next three months are as follows:
- May data: June 12, 2025
- June data: July 16, 2025
- July data: August 14, 2025
How to Use PPI to Predict Market Trends
Investors can monitor changes in the annual and monthly growth rates of PPI to assess whether upstream cost pressures are being transmitted downstream, thereby forecasting CPI trends and central bank policy direction. For example, a continuously rising PPI may signal stronger pressure for future rate hikes, favoring the respective currency; conversely, a falling PPI suggests weaker inflationary pressure, and the market may shift toward risk assets.
By combining technical analysis with PPI data, investors can more accurately identify short- and medium-term market trends.
How to Use PPI Data to Improve Forex Trading Performance
For forex traders, PPI data serves as a key leading indicator. When PPI rises and exceeds expectations, it often suggests currency appreciation due to anticipated monetary tightening; the opposite also holds true.
Suggested trading strategies:
- Watch price movements before release: markets often price in expectations in advance. If trends align with PPI forecasts, watch for breakout levels.
- Combine with other indicators: such as CPI, bond yields, and central bank statements to avoid relying on a single metric.
- Risk management: set stop-loss and take-profit orders, as PPI announcements often trigger volatility; avoid chasing highs or selling low impulsively.
For instance, when U.S. PPI exceeds expectations, the U.S. dollar tends to strengthen and EUR/USD may decline. Conversely, if PPI falls short, the dollar may weaken and EUR/USD may rise.
Why Choose Ultima Markets?
In the current market environment, choosing a reliable trading platform is critical. Ultima Markets, as a professional financial trading platform, offers the following advantages:
Global Regulation and Fund Security
Ultima Markets is regulated by multiple authorities including CySEC and ASIC. Client funds are held at Westpac Bank in Australia, strictly segregated from company capital, and insured up to USD 1 million, offering a secure and reliable trading environment for investors in Taiwan.
Professional Trading Platforms and Tools
UM provides MT4, MT5, WebTrader, and its proprietary App, integrated with Trading Central analytics and EA automated trading, helping traders capture market fluctuations triggered by PPI data and execute strategies effortlessly.
Low Cost and High Leverage Advantage
With ECN accounts offering spreads as low as 0.0 and commissions of just USD 5, and leverage up to 1:2000, Ultima Markets provides a highly competitive cost structure to maximize returns during PPI-driven moves.
Chinese Support and Educational Resources
UM offers 24/7 Chinese customer service and provides demo accounts, online courses, and strategy labs, enabling novice investors to practice trading in a risk-free environment and learn how to apply strategies around key data releases like PPI.
Conclusion
As a key indicator of price changes at the production end, the Producer Price Index (PPI) plays a vital role in forecasting inflation trends and formulating investment strategies. By keeping track of the latest PPI data, forex traders can fine-tune their strategies with greater precision. Choosing a professional platform such as Ultima Markets enables investors to effectively capture trading opportunities brought by PPI fluctuations, thereby enhancing overall investment performance.
Disclaimer: This content is provided for informational purposes only and does not constitute, and should not be construed as, financial, investment, or other professional advice. No statement or opinion contained here in should be considered a recommendation by Ultima Markets or the author regarding any specific investment product, strategy, or transaction. Readers are advised not to rely solely on this material when making investment decisions and should seek independent advice where appropriate.
Latest Articles


FOLLOW US


Ultima Markets is a member of The Financial Commission, an international independent body responsible for resolving disputes in the Forex and CFD markets.
All clients of Ultima Markets are protected under insurance coverage provided by Willis Towers Watson (WTW), a global insurance brokerage established in 1828, with claims eligibility up to US$1,000,000 per account.
Ultima Markets is the first United CFD broker to be part of the United Nations Global Compact.
FOLLOW US
TRADE WITH US
RISK DISCLOSURE
Risk Warning:
Trading leveraged financial products, including Contracts for Difference (CFDs), carries a high level of risk and may result in losses exceeding your initial investment. These products are not suitable for all investors and should only be traded with funds you can afford to lose. You do not own or have any rights to the underlying assets of these derivatives (e.g., entitlement to dividends). Please ensure you fully understand the associated risks. Before trading, consider your level of experience, investment objectives, and seek independent financial advice if necessary. Refer to our legal documents and disclosures before making any trading decisions.
General Advice Warning:
The information provided on this website is general in nature and does not take into account your personal objectives, financial situation, or needs. Before acting on any advice, you should assess its appropriateness in light of your individual circumstances and consult our legal documentation.
Regional Restrictions:
The information and services on this website are not intended for residents of certain jurisdictions, including but not limited to the United States, United Kingdom, Singapore, and any jurisdictions subject to international sanctions. For further information, please contact our customer support team.
Regulatory Information:
Ultima Markets is a trading name shared amongst multiple entities operating in various jurisdictions. These following entities are authorised to operate under the Ultima Markets brand and trademarks.
-
Ultima Markets UK Limited, reference number 470325, is authorised and regulated by the Financial Conduct Authority (FCA). Registered address: 1 Blossom Yard, Fourth Floor, London, E1 6RS, UNITED KINGDOM.
-
Ultima Markets Ltd is authorised and regulated by the Financial Services Commission (FSC) of Mauritius as a Full-Service Investment Dealer (excluding Underwriting), under licence number GB 23201593.
Registered address: 2nd Floor, The Catalyst, 40 Silicon Avenue, Ebene Cybercity, 72201, Mauritius.
Copyright © 2026 Ultima Markets Ltd. All rights reserved.
-

Messenger


Continue on Messenger
Take the conversation to your Messenger account. You can return anytime.
Scan the QR code and then send the message that appears in your Messenger.
Open Messenger on this device.
-

Instagram

Continue on Instagram
Take the conversation to your Instagram account. You can return anytime.
Scan the QR code to open Instagram. Follow @ultima_markets to send a DM.
Open Instagram on this device.
-

Live Chat
-
