Important Information
This website is managed by Ultima Markets’ international entities, and it’s important to emphasise that they are not subject to regulation by the FCA in the UK. Therefore, you must understand that you will not have the FCA’s protection when investing through this website – for example:
- You will not be guaranteed Negative Balance Protection
- You will not be protected by FCA’s leverage restrictions
- You will not have the right to settle disputes via the Financial Ombudsman Service (FOS)
- You will not be protected by Financial Services Compensation Scheme (FSCS)
- Any monies deposited will not be afforded the protection required under the FCA Client Assets Sourcebook. The level of protection for your funds will be determined by the regulations of the relevant local regulator.
Note: UK clients are kindly invited to visit https://www.ultima-markets.co.uk/. Ultima Markets UK expects to begin onboarding UK clients in accordance with FCA regulatory requirements in 2026.
If you would like to proceed and visit this website, you acknowledge and confirm the following:
- 1.The website is owned by Ultima Markets’ international entities and not by Ultima Markets UK Ltd, which is regulated by the FCA.
- 2.Ultima Markets Limited, or any of the Ultima Markets international entities, are neither based in the UK nor licensed by the FCA.
- 3.You are accessing the website at your own initiative and have not been solicited by Ultima Markets Limited in any way.
- 4.Investing through this website does not grant you the protections provided by the FCA.
- 5.Should you choose to invest through this website or with any of the international Ultima Markets entities, you will be subject to the rules and regulations of the relevant international regulatory authorities, not the FCA.
Ultima Markets wants to make it clear that we are duly licensed and authorised to offer the services and financial derivative products listed on our website. Individuals accessing this website and registering a trading account do so entirely of their own volition and without prior solicitation.
By confirming your decision to proceed with entering the website, you hereby affirm that this decision was solely initiated by you, and no solicitation has been made by any Ultima Markets entity.
I confirm my intention to proceed and enter this website Please direct me to the website operated by Ultima Markets , regulated by the FCA in the United Kingdom
Ultima Markets App
Trade Anytime, Anywhere


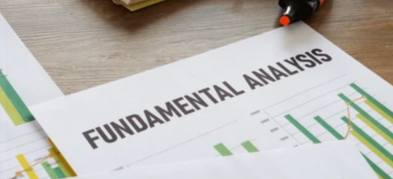
What is Fundamental Analysis in Stock Trading?
Fundamental analysis in stock trading helps you understand what drives a stock’s value over time. It focuses on a company’s earnings, cash flow, balance sheet strength, and business quality, while also considering broader economic factors such as interest rates, inflation, and economic growth.
By analysing these elements together, traders and investors can assess whether a stock’s current market price reflects its underlying value.

Most traders use “what is fundamental analysis in stock trading” to answer three practical questions: What is this company worth based on its business performance? What could change that value in the next few quarters? And what risks could invalidate the view?
By combining company data with industry and macro context, you can filter out noise, focus on high-impact catalysts, and build a clearer plan for position sizing and risk control.
What Fundamental Analysis Tries To Measure
What is fundamental analysis in stock trading? Fundamental analysis aims to estimate a stock’s intrinsic value, meaning the value that makes sense based on the company’s real world fundamentals rather than short term price swings.
You usually compare:
- Intrinsic value estimate based on fundamentals
- Market price set by buyers and sellers
If your analysis suggests intrinsic value is higher than the current price, the stock may look undervalued. If it is lower, it may look overvalued. This is not a guarantee of outcomes. It is a structured way to form a view.

The Three Layers Of Fundamental Analysis
A practical workflow uses a top down structure. It keeps your analysis logical and prevents you from judging a stock in isolation.
Economic Analysis
Economic conditions influence all companies, but the impact differs by sector.
Focus on factors that directly change valuations and earnings expectations:
- Central bank policy and interest rates
- Inflation trends and real purchasing power
- Economic activity and recession risk
- Labour market strength and wage pressure
- Currency moves for global companies
Macro data can shift discount rates and risk appetite quickly, which often moves whole indices and sectors before individual stock stories catch up.
Industry Analysis
A great company can still underperform in a weak industry. Industry analysis helps you understand the playing field.
Check:
- Demand drivers and long term tailwinds
- Competitive intensity and pricing power
- Regulation and policy sensitivity
- Technology disruption risk
- Supply chain constraints and input costs
Sector rotation is real. Funds often move by theme, sector, and factor exposure, which can overpower single name fundamentals in the short run.
Company Analysis
This is where you judge the business itself.
Assess:
- Revenue quality and growth drivers
- Profit margins and operating leverage
- Cash flow reliability
- Balance sheet risk and debt maturity profile
- Management execution and guidance credibility
- Competitive advantage and moat strength
Company fundamentals define the narrative for earnings. If the market expects one story and results confirm a different one, price can re rate fast.
Quantitative And Qualitative Fundamental Analysis
Strong fundamental analysis uses both numbers and judgment.
Quantitative Analysis
You analyse what you can measure, such as:
- Revenue and earnings trends
- Gross margin and operating margin
- Free cash flow and cash conversion
- Return on equity and return on invested capital
- Debt ratios and interest coverage
Qualitative Analysis
You evaluate what sits behind the numbers:
- Business model resilience
- Customer concentration and churn risk
- Brand strength and distribution advantage
- Management credibility and capital allocation discipline
- Competitive positioning and product roadmap
A common mistake is relying on a single ratio like P E without understanding the business cycle, accounting distortions, or why the multiple exists.
The Financial Statements You Should Understand
To do fundamental analysis in stock trading, you need to read three core financial statements together. Each statement answers a different question, and the real insight comes from how they connect.
To make this practical, imagine a simple example company called AlphaTech, a consumer electronics brand.
Income Statement
How much the company earned over a period and how efficiently it generated profit.
- Revenue trend and where it comes from
- Gross margin and operating margin
- One off gains or expenses that distort earnings
For example, AlphaTech reports revenue up 12% year on year. On the surface, that looks strong. But you notice its gross margin fell from 45% to 38% because component costs rose and the company discounted products to defend market share. That tells you the business is selling more, but earning less per sale, which can pressure future earnings.
Balance Sheet
What the company owns, what it owes, and how much financial risk it carries.
- Cash and short term liquidity
- Total debt and debt maturity schedule
- Working capital movements such as inventory and receivables
For example, AlphaTech’s balance sheet shows inventory jumped 30% while revenue grew 12%. That can mean demand is slowing, products are not moving, or the company overproduced. At the same time, long term debt increased, which raises interest costs and refinancing risk if rates stay high.
Cash Flow Statement
Whether the company is actually generating cash, not just reporting accounting profits.
- Operating cash flow versus net income
- Capital expenditure and reinvestment needs
- Free cash flow stability over time
For example, AlphaTech posts higher net income, but operating cash flow drops because customers are taking longer to pay and receivables are rising. That gap is a warning sign. A company can look profitable on paper but still face cash pressure, especially if it needs to fund inventory and debt payments.
How The Three Statements Connect
- Income statement says AlphaTech is growing revenue, but margins are falling.
- Balance sheet says inventory and debt are rising.
- Cash flow statement confirms cash generation is weakening.
Even if the stock rallies on headline earnings, these signals can explain why the market later re prices the stock after guidance, margins, or cash flow concerns become the focus.
How Traders Use Fundamental Analysis
Fundamental analysis becomes trading relevant when you connect it to catalysts and positioning.

Earnings Season Trading
Before earnings, build a view on what the market expects, what results could surprise, how guidance might shift forward estimates.
Price often reacts more to guidance and margins than headline EPS.
Macro And Rate Sensitivity
Rates influence valuation multiples. When yields rise, long duration growth stocks often face multiple compression even if earnings remain solid.
News And Event Risk
Fundamentals help you separate signal from noise. Ask does this change cash flow expectations, does this change competitive position, does this change cost of capital or regulation risk.
Pros And Cons Of Fundamental Analysis
Advantages
- Helps you understand real drivers of value
- Supports higher conviction decisions
- Works well for longer time horizons
- Improves discipline around catalysts and thesis changes
Disadvantages
- Takes time and can feel slow
- Depends on assumptions and estimates
- Markets can re price before fundamentals show up in reported data
- Short term moves often reflect sentiment and liquidity
Conclusion
What is fundamental analysis in stock trading? It is a disciplined way to assess stock values by evaluating economic, industry, and company data together. This approach helps avoid trading on headlines or short-term price fluctuations, especially during earnings season or periods of macro uncertainty.
When combined with solid risk management, fundamental analysis in stock trading offers a valuable framework for navigating volatile markets, allowing traders to focus on the underlying business value rather than speculation.
Platforms like Ultima Markets support share trading by giving traders access to global equity markets alongside analytical tools and market insights. With the right data and structure, fundamental analysis allows traders to approach share trading with greater clarity, consistency, and confidence, focusing on business value rather than short-term speculation.
FAQs
Fundamental analysis evaluates a company’s financial health, economic factors, and market trends to determine its stock value and potential for growth.
It helps traders make informed decisions by identifying undervalued or overvalued stocks, guiding long-term investment strategies.
You analyse financial statements, industry conditions, and macroeconomic factors like interest rates and GDP growth to assess a stock’s value.
Disclaimer: This content is provided for informational purposes only and does not constitute, and should not be construed as, financial, investment, or other professional advice. No statement or opinion contained here in should be considered a recommendation by Ultima Markets or the author regarding any specific investment product, strategy, or transaction. Readers are advised not to rely solely on this material when making investment decisions and should seek independent advice where appropriate.
Latest Articles


FOLLOW US


Ultima Markets is a member of The Financial Commission, an international independent body responsible for resolving disputes in the Forex and CFD markets.
All clients of Ultima Markets are protected under insurance coverage provided by Willis Towers Watson (WTW), a global insurance brokerage established in 1828, with claims eligibility up to US$1,000,000 per account.
Ultima Markets is the first United CFD broker to be part of the United Nations Global Compact.
FOLLOW US
TRADE WITH US
RISK DISCLOSURE
Risk Warning:
Trading leveraged financial products, including Contracts for Difference (CFDs), carries a high level of risk and may result in losses exceeding your initial investment. These products are not suitable for all investors and should only be traded with funds you can afford to lose. You do not own or have any rights to the underlying assets of these derivatives (e.g., entitlement to dividends). Please ensure you fully understand the associated risks. Before trading, consider your level of experience, investment objectives, and seek independent financial advice if necessary. Refer to our legal documents and disclosures before making any trading decisions.
General Advice Warning:
The information provided on this website is general in nature and does not take into account your personal objectives, financial situation, or needs. Before acting on any advice, you should assess its appropriateness in light of your individual circumstances and consult our legal documentation.
Regional Restrictions:
The information and services on this website are not intended for residents of certain jurisdictions, including but not limited to the United States, United Kingdom, Singapore, and any jurisdictions subject to international sanctions. For further information, please contact our customer support team.
Regulatory Information:
Ultima Markets is a trading name shared amongst multiple entities operating in various jurisdictions. These following entities are authorised to operate under the Ultima Markets brand and trademarks.
-
Ultima Markets UK Limited, reference number 470325, is authorised and regulated by the Financial Conduct Authority (FCA). Registered address: 1 Blossom Yard, Fourth Floor, London, E1 6RS, UNITED KINGDOM.
-
Ultima Markets Ltd is authorised and regulated by the Financial Services Commission (FSC) of Mauritius as a Full-Service Investment Dealer (excluding Underwriting), under licence number GB 23201593.
Registered address: 2nd Floor, The Catalyst, 40 Silicon Avenue, Ebene Cybercity, 72201, Mauritius.
-
Ultima Markets EU OÜ, incorporated in Estonia with registry code 17134727. Registered address: Harju maakond, Tallinn, Kristiine linnaosa, Seebi tn 1-1501, 11316. This entity does not offer regulated financial products or provide trading services.
Copyright © 2026 Ultima Markets Ltd. All rights reserved.
-

Messenger


Continue on Messenger
Take the conversation to your Messenger account. You can return anytime.
Scan the QR code and then send the message that appears in your Messenger.
Open Messenger on this device.
-

Instagram

Continue on Instagram
Take the conversation to your Instagram account. You can return anytime.
Scan the QR code to open Instagram. Follow @ultima_markets to send a DM.
Open Instagram on this device.
-

Live Chat
-
