This website is managed by Ultima Markets’ international entities, and it’s important to emphasise that they are not subject to regulation by the FCA in the UK. Therefore, you must understand that you will not have the FCA’s protection when investing through this website – for example:
You will not be guaranteed Negative Balance Protection
You will not be protected by FCA’s leverage restrictions
You will not have the right to settle disputes via the Financial Ombudsman Service (FOS)
You will not be protected by Financial Services Compensation Scheme (FSCS)
Any monies deposited will not be afforded the protection required under the FCA Client Assets Sourcebook. The level of protection for your funds will be determined by the regulations of the relevant local regulator.
Note: UK clients are kindly invited to visit https://www.ultima-markets.co.uk/. Ultima Markets UK expects to begin onboarding UK clients in accordance with FCA regulatory requirements in 2026.
If you would like to proceed and visit this website, you acknowledge and confirm the following:
1.The website is owned by Ultima Markets’ international entities and not by Ultima Markets UK Ltd, which is regulated by the FCA.
2.Ultima Markets Limited, or any of the Ultima Markets international entities, are neither based in the UK nor licensed by the FCA.
3.You are accessing the website at your own initiative and have not been solicited by Ultima Markets Limited in any way.
4.Investing through this website does not grant you the protections provided by the FCA.
5.Should you choose to invest through this website or with any of the international Ultima Markets entities, you will be subject to the rules and regulations of the relevant international regulatory authorities, not the FCA.
Ultima Markets wants to make it clear that we are duly licensed and authorised to offer the services and financial derivative products listed on our website. Individuals accessing this website and registering a trading account do so entirely of their own volition and without prior solicitation.
By confirming your decision to proceed with entering the website, you hereby affirm that this decision was solely initiated by you, and no solicitation has been made by any Ultima Markets entity.
Learn how to draw a trend line in trading with clear steps and tips. See examples to identify trends, find swing lows, and validate trend line strength.
In the world of trading, whether in forex, stocks, or commodities, understanding how to read market charts is essential. One of the fundamental tools that traders use to analyse price movements is the trend line.
Trend lines are used to identify the direction of price movement, offering traders insight into the market’s current state. In this article, we will break down the concept of trend lines, how they work, and how to use them effectively in your trading strategy.
What Is a Trend Line?
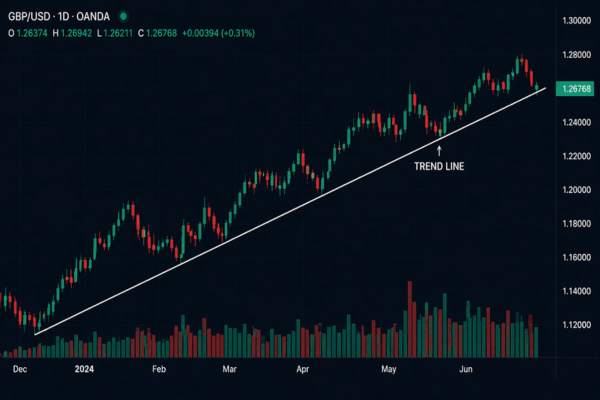
A trend line is a straight line drawn on a price chart that connects two or more significant price points, typically highs or lows. These lines help to visualise the prevailing direction in which the price of an asset is moving. Trend lines are the foundation of technical analysis, where the primary aim is to study price history to predict future movements.
When drawn correctly, a trend line represents market sentiment. For example, an uptrend indicates that the buyers are in control, while a downtrend shows that the sellers are dominating. If the market moves sideways, a trend line can help define key support and resistance levels.
Types of Trend Lines
There are three primary types of trend lines that traders use to interpret market movements:
1. Uptrend (Bullish Trend Line)
An uptrend is formed when you connect a series of rising lows. As the price moves upwards, each low is higher than the previous one. The trend line is drawn below the price action.
In this case, the market is in a bullish phase, and the price is expected to continue to rise as long as it stays above the trend line. Traders often look to buy at pullbacks to the trend line.
2. Downtrend (Bearish Trend Line)
A downtrend is created by connecting a series of declining highs. As the price moves downward, each high is lower than the previous one. The trend line is drawn above the price action.
A downtrend indicates a bearish market, and the price is expected to continue falling as long as it stays below the trend line. Traders will often look for selling opportunities as the price rallies back to the trend line.
3. Sideways or Horizontal Trend Line (Range-bound Market)
In a sideways market, the price moves within a certain range. Here, the trend line is drawn across both peaks (resistance) and troughs (support). This type of market indicates indecision, where neither the bulls nor the bears have control.
Trend lines in such a market highlight the potential breakout points, signalling when the price is likely to move out of the range and into a new trend.
How to Draw a Trend Line
Drawing a trend line requires precision. Here’s a simple process for accurately drawing trend lines:
Identify Significant Points Find key peaks or troughs in the price action where the market reversed direction. These are the points you will use to draw your trend line.
Connect the Points
For an uptrend: connect rising lows
For a downtrend: connect falling highs Make sure the trend line touches at least two price points. The more touches on the trend line, the more reliable it becomes.
Extend the Line Once the points are connected, extend the line forward. This extension will give you a projection of the potential future price action. A valid trend line should remain intact as long as the price respects it.
Why Trend Lines Matter
Trend lines are crucial because they help traders understand the broader picture of market movements. Here’s why they are so important:
1. Market Direction
Trend lines help traders quickly identify the direction of the market. They allow you to see whether the price is in an uptrend, downtrend, or moving sideways. By understanding the trend, you can make informed decisions about when to enter or exit a trade.
For example, in an uptrend, traders might buy on dips, while in a downtrend, they might consider shorting rallies.
2. Support and Resistance Levels
Trend lines can also act as dynamic support or resistance levels. In an uptrend, the trend line provides support where the price tends to bounce back up. In a downtrend, the trend line acts as resistance, where price typically struggles to break through.
Identifying these levels can help you spot entry and exit points for your trades.
3. Breakouts and Reversals
When price breaks through a trend line, it can signal a trend reversal or a breakout. For example, a break above a downtrend line may indicate the start of an uptrend, while a break below an uptrend line may suggest a bearish reversal.
Trend line breakouts can be strong signals for entering trades, but they should always be confirmed with other indicators, such as volume or oscillators, to avoid false signals.
How to Use Trend Lines in Trading
There are two common ways traders use trend lines in their trading strategies:
1. Trend Continuation Strategy
In a strong uptrend, traders might look to buy whenever the price pulls back to the trend line. Similarly, in a downtrend, traders might look to sell when the price retraces to the trend line. The idea is that the trend will continue in the same direction once the pullback ends.
2. Trend Reversal Strategy
When price breaks through a trend line, it may indicate a trend reversal. Traders can use this as an opportunity to enter a trade in the opposite direction. For example, a break of a downtrend line could signal the beginning of an uptrend, offering a buying opportunity.
Common Mistakes to Avoid with Trend Lines
While trend lines are an incredibly useful tool, there are some common mistakes that traders should be aware of:
1. Over-Reliance on Trend Lines
Trend lines should not be the only tool you use to make trading decisions. While they are helpful, relying solely on them without considering other indicators, such as volume, oscillators, or chart patterns, can lead to poor decisions.
2. Drawing Trend Lines Incorrectly
Drawing trend lines too quickly or without considering the most significant price points can lead to inaccurate analysis. Be patient and make sure your trend line connects meaningful price points that reflect the broader market movement.
3. Ignoring Breakouts
A trend line break can often signal a major change in market direction. Ignoring these breakouts can result in missed opportunities. Pay attention to these events and consider using them as signals to enter or exit a trade.
Conclusion
Trend lines are an essential tool in technical analysis. They help traders identify the direction of the market, key support and resistance levels, and potential trend reversals.
While they are simple to use, their effectiveness depends on careful drawing and confirmation with other indicators.
By incorporating trend lines into your trading strategy, you can gain valuable insights into market trends, improve your decision-making, and potentially increase your chances of success.
FAQs
How do I know if a trend line is valid?
A trend line is valid if it connects at least two significant price points and the price continues to respect it over time.
What happens when a trend line breaks?
A break of a trend line can signal a trend reversal or acceleration. However, it’s essential to confirm this with other indicators.
Can I use trend lines for short-term trading?
Trend lines work best in longer timeframes but can also be applied to short-term charts. Just ensure you confirm signals with other indicators to reduce the risk of false breakouts.
Share Now
Disclaimer:This content is provided for informational purposes only and does not constitute, and should not be construed as, financial, investment, or other professional advice. No statement or opinion contained herein should be considered a recommendation by Ultima Markets or the author regarding any specific investment product, strategy, or transaction. Readers are advised not to rely solely on this material when making investment decisions and should seek independent advice where appropriate.
Thank you for visiting the Ultima Markets website. Please note that this website is intended for individuals residing in jurisdictions where access is permitted by law. Ultima and its affiliated entities do not operate in your home jurisdiction.
By clicking ‘Acknowledge’, you confirm that you are entering this website solely on your own initiative and not as a result of any specific marketing outreach. You wish to obtain information from this website based on reverse solicitation principles, in accordance with the applicable laws of your home jurisdiction.