
Ultima Markets App
Trade Anytime, Anywhere
Important Information
This website is managed by Ultima Markets’ international entities, and it’s important to emphasise that they are not subject to regulation by the FCA in the UK. Therefore, you must understand that you will not have the FCA’s protection when investing through this website – for example:
- You will not be guaranteed Negative Balance Protection
- You will not be protected by FCA’s leverage restrictions
- You will not have the right to settle disputes via the Financial Ombudsman Service (FOS)
- You will not be protected by Financial Services Compensation Scheme (FSCS)
- Any monies deposited will not be afforded the protection required under the FCA Client Assets Sourcebook. The level of protection for your funds will be determined by the regulations of the relevant local regulator.
Note: Ultima Markets is currently developing a dedicated website for UK clients and expects to onboard UK clients under FCA regulations in 2026.
If you would like to proceed and visit this website, you acknowledge and confirm the following:
- 1.The website is owned by Ultima Markets’ international entities and not by Ultima Markets UK Ltd, which is regulated by the FCA.
- 2.Ultima Markets Limited, or any of the Ultima Markets international entities, are neither based in the UK nor licensed by the FCA.
- 3.You are accessing the website at your own initiative and have not been solicited by Ultima Markets Limited in any way.
- 4.Investing through this website does not grant you the protections provided by the FCA.
- 5.Should you choose to invest through this website or with any of the international Ultima Markets entities, you will be subject to the rules and regulations of the relevant international regulatory authorities, not the FCA.
Ultima Markets wants to make it clear that we are duly licensed and authorised to offer the services and financial derivative products listed on our website. Individuals accessing this website and registering a trading account do so entirely of their own volition and without prior solicitation.
By confirming your decision to proceed with entering the website, you hereby affirm that this decision was solely initiated by you, and no solicitation has been made by any Ultima Markets entity.
I confirm my intention to proceed and enter this website Please direct me to the website operated by Ultima Markets , regulated by the FCA in the United Kingdom

What Is A Rejection Block? How To Use It?
A rejection block is a price zone where the market attempts to break higher or lower, but gets strongly rejected, leaving behind a prominent wick. Traders often treat that wick zone as an “area of interest” because when price revisits it, the market can react again.
This article breaks down what a rejection block is, why it forms, how to identify it on candlesticks, and a practical execution model that keeps your process structured and repeatable.
What Is a Rejection Block?
A rejection block refers to a price level where the market tries to continue beyond a key area (such as support, resistance, supply, or demand), but fails to hold and reverses sharply. The rejection is usually visible as a long wick on the candle, showing that price was pushed beyond a level and then quickly pulled back.
In simple terms, it is the market saying: “We tested beyond this level, but there wasn’t enough acceptance to continue.”
Why Does Rejection Blocks Form
Rejection blocks often appear around levels where many orders cluster. In smart money style frameworks, the rejection is commonly explained through four mechanisms.
Liquidity Collection Around Key Levels
Markets need liquidity to move. Around major highs/lows and obvious zones, traders often place:
- stop-loss orders
- breakout entries
- pending buy stops or sell stops
A brief push beyond the level can trigger those orders, providing liquidity for larger participants.
Stop Hunts and Breakout Traps
A common pattern is a “fake breakout”:
- price breaks above resistance (or below support)
- breakout traders enter
- stops get triggered
- price reverses quickly, leaving a strong wick
This is why rejection blocks are frequently linked to “trap” behaviour at obvious levels.
Order Absorption
Another explanation is absorption. After price reaches a liquidity zone, large buy or sell interest can absorb the remaining flow. When the opposing side is absorbed, price can no longer continue in that direction, and it rejects, leaving a wick.
Imbalance After Rejection
After rejection, price often moves away rapidly, creating a fast displacement. Some traders view that as an “imbalance” that can encourage a later revisit to the rejection area before price continues in the new direction.
Key Characteristics of a High-Quality Rejection Block
Not every wick is meaningful. Higher-quality rejection blocks tend to have these traits:
1) Strong Rejection Wick
A clear, extended wick suggests the move beyond the level was rejected. In general, the cleaner and more obvious the wick, the easier it is to define the zone.
2) Sharp Reversal Away From the Level
A strong rejection is often followed by an aggressive move away in the opposite direction, sometimes with little consolidation. The speed of the move is part of the “footprint.”
3) Appears at a Meaningful Location
Rejection blocks are most useful when they form at:
- swing highs or swing lows
- clear support and resistance
- supply and demand zones
- prior session highs/lows or other widely watched levels
4) Signs of “Participation”
If you use volume, a notable spike during the rejection can add confidence that the level attracted significant order flow. This is optional, but it can help you avoid treating random wicks as signals.
Bullish vs Bearish Rejection Block
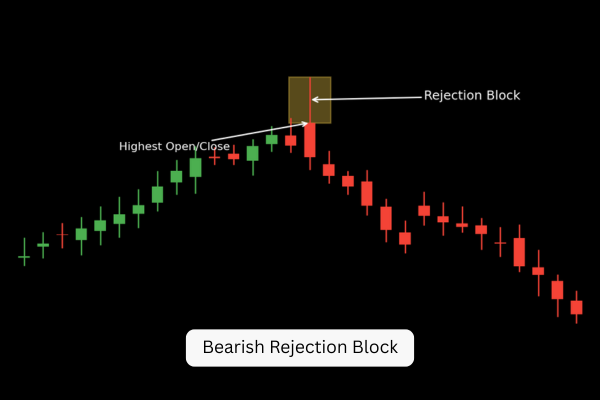
Bearish Rejection Block
A bearish rejection block forms when price pushes up into a key area and rejects lower, leaving an upper wick. Traders often mark the wick zone as potential resistance on a retest.
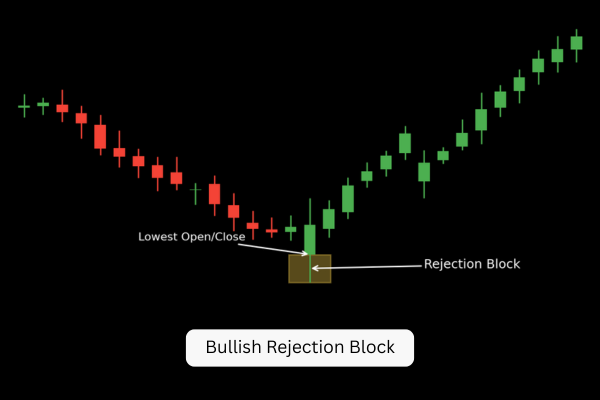
Bullish Rejection Block
A bullish rejection block forms when price pushes down into a key area and rejects higher, leaving a lower wick. Traders often mark the wick zone as potential support on a retest.
How to Identify a Rejection Block Using a Candlestick Sequence
A practical way to recognise a rejection block is a simple three-candle sequence.
1) Impulse Candle
A strong move that drives price into or through a key level. This is often the candle associated with a liquidity run.
2) Rejection Candle
A candle that shows sharp rejection through a long wick, indicating strong opposition to higher or lower prices.
3) Confirmation Candle
A candle that closes in the opposite direction, helping confirm that control has shifted and the market is reversing.
Which Wick Defines the Rejection Block?
In some cases, the confirmation candle’s wick can be longer than the rejection candle’s wick. When that happens, many traders treat the longest wick in the sequence as the relevant rejection zone, since it represents the most extreme rejection point.
The 50% Level of a Rejection Block
A commonly used refinement is the 50% level (midpoint) of the rejection block. Traders watch this midpoint because it can behave like a “decision line” on retests.
- In bearish setups, the midpoint can act like a resistance area.
- In bullish setups, the midpoint can act like a support area.
It is often used for:
- more precise entries
- risk management structure
- evaluating whether price has “tapped” deep enough into the zone to justify taking a setup
How Traders Use a Rejection Block
The cleanest approach is to treat a rejection block as a higher timeframe location and use a lower timeframe trigger for entries.
Step 1: Mark the Rejection Block on a Higher Timeframe
Start from a higher timeframe such as 4H, 1H, or 30m and identify:
- a clear rejection wick at a meaningful level
- a sharp move away from the wick zone
- ideally, signs of a liquidity sweep (brief push beyond a prior high/low)
Step 2: Wait for Price to Return to the Rejection Block
Rather than chasing the initial reversal, many traders wait for the market to revisit the zone. This is where the rejection block becomes actionable as a retest area.
Step 3: Drop to a Lower Timeframe for Confirmation
Once price taps into the rejection block, switch to a lower timeframe (often 5m or 15m) and look for confirmation such as:
- a market structure shift (the market breaks and closes beyond a recent swing in the new direction)
- a lower timeframe “entry zone” that fits your model, for example:
- a fair value gap
- an order block
- a breaker block
- a mitigation-type zone
You don’t need to use every tool. The key is consistency: rejection block = location, lower timeframe = trigger.
Step 4: Stop-Loss and Take-Profit Logic
Stop-loss (common structure):
- Bearish setup: place the stop above the relevant swing high / rejection wick.
- Bullish setup: place the stop below the relevant swing low / rejection wick.
Take-profit options:
- Target the nearest draw on liquidity on your execution timeframe.
- Or target a higher timeframe draw on liquidity for larger potential moves.
Pick one approach that matches your risk style, then apply it consistently.
Common Mistakes With Rejection Blocks
Treating Any Wick as a Rejection Block
A wick without context is just a wick. The edge comes from the combination of location, rejection, and follow-through.
Ignoring the Higher Timeframe Bias
A rejection block against the broader market profile can fail more often. Aligning with the dominant direction typically improves selectivity.
Entering Without a Trigger
“Touch trades” can work, but waiting for a structure shift or a clear lower timeframe model often reduces guesswork.
Over-tight Stop Placement
If your stop sits too close to the zone, normal volatility can knock you out even if the idea is valid. Stops should respect the wick structure you are trading.
A rejection block is a price zone where the market attempts to break higher or lower but gets rejected strongly, leaving a clear wick. Traders often treat that wick zone as a future reaction area.
It can be either. A long upper wick at a key level is often treated as bearish rejection, while a long lower wick is often treated as bullish rejection.
A common method is to mark the rejection block on a higher timeframe, wait for price to return to it, then use lower timeframe confirmation (like a market structure shift and an entry zone) before placing a trade with defined stop-loss and take-profit targets.
Disclaimer: This content is provided for informational purposes only and does not constitute, and should not be construed as, financial, investment, or other professional advice. No statement or opinion contained here in should be considered a recommendation by Ultima Markets or the author regarding any specific investment product, strategy, or transaction. Readers are advised not to rely solely on this material when making investment decisions and should seek independent advice where appropriate.
Latest Articles


FOLLOW US


Ultima Markets is a member of The Financial Commission, an international independent body responsible for resolving disputes in the Forex and CFD markets.
All clients of Ultima Markets are protected under insurance coverage provided by Willis Towers Watson (WTW), a global insurance brokerage established in 1828, with claims eligibility up to US$1,000,000 per account.
Ultima Markets is the first United CFD broker to be part of the United Nations Global Compact.
FOLLOW US
TRADE WITH US
RISK DISCLOSURE
Risk Warning:
Trading leveraged financial products, including Contracts for Difference (CFDs), carries a high level of risk and may result in losses exceeding your initial investment. These products are not suitable for all investors and should only be traded with funds you can afford to lose. You do not own or have any rights to the underlying assets of these derivatives (e.g., entitlement to dividends). Please ensure you fully understand the associated risks. Before trading, consider your level of experience, investment objectives, and seek independent financial advice if necessary. Refer to our legal documents and disclosures before making any trading decisions.
General Advice Warning:
The information provided on this website is general in nature and does not take into account your personal objectives, financial situation, or needs. Before acting on any advice, you should assess its appropriateness in light of your individual circumstances and consult our legal documentation.
Regional Restrictions:
The information and services on this website are not intended for residents of certain jurisdictions, including but not limited to the United States, United Kingdom, Singapore, and any jurisdictions subject to international sanctions. For further information, please contact our customer support team.
Regulatory Information:
Ultima Markets is a trading name shared amongst multiple entities operating in various jurisdictions. These following entities are authorised to operate under the Ultima Markets brand and trademarks.
-
Ultima Markets UK Limited, reference number 470325, is authorised and regulated by the Financial Conduct Authority (FCA). Registered address: 1 Blossom Yard, Fourth Floor, London, E1 6RS, UNITED KINGDOM.
-
Ultima Markets Ltd is authorised and regulated by the Financial Services Commission (FSC) of Mauritius as a Full-Service Investment Dealer (excluding Underwriting), under licence number GB 23201593.
Registered address: 2nd Floor, The Catalyst, 40 Silicon Avenue, Ebene Cybercity, 72201, Mauritius.
Copyright © 2026 Ultima Markets Ltd. All rights reserved.
-

Messenger


Continue on Messenger
Take the conversation to your Messenger account. You can return anytime.
Scan the QR code and then send the message that appears in your Messenger.
Open Messenger on this device.
-

Instagram

Continue on Instagram
Take the conversation to your Instagram account. You can return anytime.
Scan the QR code to open Instagram. Follow @ultima_markets to send a DM.
Open Instagram on this device.
-

Live Chat
-
