Important Information
This website is managed by Ultima Markets’ international entities, and it’s important to emphasise that they are not subject to regulation by the FCA in the UK. Therefore, you must understand that you will not have the FCA’s protection when investing through this website – for example:
- You will not be guaranteed Negative Balance Protection
- You will not be protected by FCA’s leverage restrictions
- You will not have the right to settle disputes via the Financial Ombudsman Service (FOS)
- You will not be protected by Financial Services Compensation Scheme (FSCS)
- Any monies deposited will not be afforded the protection required under the FCA Client Assets Sourcebook. The level of protection for your funds will be determined by the regulations of the relevant local regulator.
Note: UK clients are kindly invited to visit https://www.ultima-markets.co.uk/. Ultima Markets UK expects to begin onboarding UK clients in accordance with FCA regulatory requirements in 2026.
If you would like to proceed and visit this website, you acknowledge and confirm the following:
- 1.The website is owned by Ultima Markets’ international entities and not by Ultima Markets UK Ltd, which is regulated by the FCA.
- 2.Ultima Markets Limited, or any of the Ultima Markets international entities, are neither based in the UK nor licensed by the FCA.
- 3.You are accessing the website at your own initiative and have not been solicited by Ultima Markets Limited in any way.
- 4.Investing through this website does not grant you the protections provided by the FCA.
- 5.Should you choose to invest through this website or with any of the international Ultima Markets entities, you will be subject to the rules and regulations of the relevant international regulatory authorities, not the FCA.
Ultima Markets wants to make it clear that we are duly licensed and authorised to offer the services and financial derivative products listed on our website. Individuals accessing this website and registering a trading account do so entirely of their own volition and without prior solicitation.
By confirming your decision to proceed with entering the website, you hereby affirm that this decision was solely initiated by you, and no solicitation has been made by any Ultima Markets entity.
I confirm my intention to proceed and enter this website Please direct me to the website operated by Ultima Markets , regulated by the FCA in the United Kingdom
Ultima Markets App
Trade Anytime, Anywhere


What Is A Good PE Ratio For A Stock?
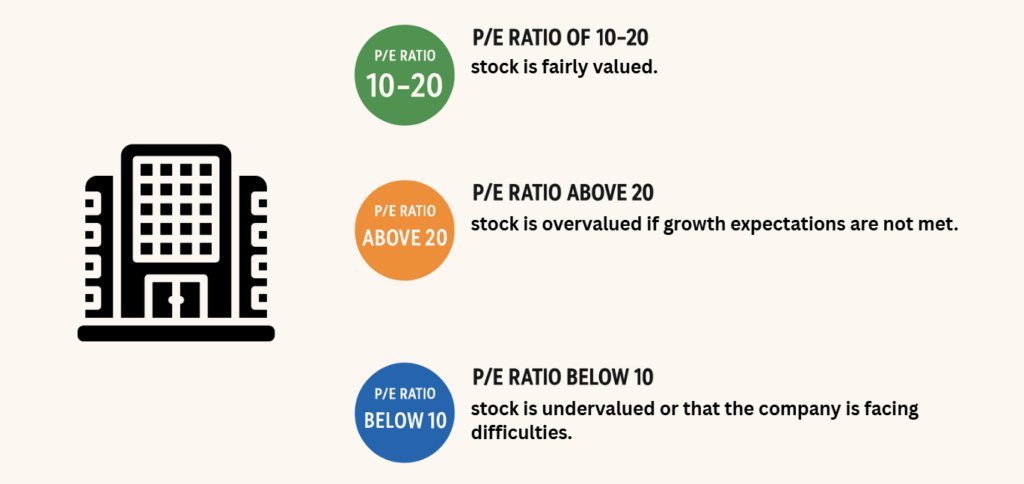
Wondering what is a good pe ratio for a stock? A good P/E ratio for a stock is typically between 10 and 20, which is considered reasonable for most stable, mature companies. However, what is considered “good” can vary based on factors like the company’s industry, growth potential, and current market conditions.
- P/E ratio of 10-20: This range is often seen in established companies that show steady earnings growth and have a stable market position. A P/E ratio in this range suggests the stock is fairly valued.
- P/E ratio above 20: A higher P/E ratio is often seen in high-growth sectors, such as technology, where investors expect strong future earnings growth. While this can indicate potential, it may also suggest the stock is overvalued if growth expectations are not met.
- P/E ratio below 10: A lower P/E ratio might indicate that the stock is undervalued or that the company is facing difficulties. Investors often look for opportunities in this range, but it requires a deeper analysis to ensure there are no underlying risks.
Ultimately, a “good” P/E ratio is relative, and comparing it with industry peers and the company’s historical performance is essential for making a sound investment decision.
What Is A PE Ratio For A Stock
The P/E ratio (Price-to-Earnings ratio) for a stock is a financial metric used to evaluate the valuation of a company’s stock. It is calculated by dividing the market price per share by the earnings per share (EPS).
P/E Ratio Formula: P/E Ratio = Price per Share / Earnings per Share (EPS)
The P/E ratio shows how much investors are willing to pay for each dollar of a company’s earnings. A higher P/E ratio indicates that investors expect strong future growth, while a lower P/E ratio may suggest undervaluation or lower growth expectations.
For example, if a company’s stock is priced at $50 per share and it has an EPS of $5, the P/E ratio would be 50/5 is 10. This means investors are willing to pay 10 times the company’s earnings per share for each share of stock.
The P/E ratio can be a useful tool for comparing the relative value of stocks in the same industry or sector. However, it should be used alongside other financial metrics to get a complete view of a company’s financial health and potential for growth.
Types of P/E Ratios for Stock
There are two main types of P/E ratios used to evaluate stocks:
Trailing P/E Ratio (TTM)
The trailing P/E ratio is based on a company’s earnings over the past 12 months (Trailing Twelve Months – TTM). It uses historical earnings data. This is the most commonly used P/E ratio because it reflects a company’s actual performance, using reported earnings.
Trailing P/E = Price per Share / Earnings per Share (EPS) for the past 12 months
It is based on real, confirmed earnings data, making it more reliable. However, it doesn’t account for future growth or upcoming events that may impact the company’s performance.
Forward P/E Ratio
The forward P/E ratio uses projected earnings for the next 12 months (based on analysts’ estimates or company guidance) instead of historical earnings. This ratio helps investors assess a company’s future potential based on expected earnings.
Forward P/E = Price per Share / Projected EPS for the next 12 months
It is useful for growth stocks or companies in industries with rapid changes, as it reflects expectations for the future. However, it depends on estimates, which can be inaccurate or subject to change based on market conditions or unforeseen factors.
Trailing P/E is more appropriate for evaluating established companies with stable earnings. Forward P/E is better for growth stocks or companies in dynamic sectors, like technology, where future earnings are more relevant. Both ratios provide important insights, and comparing them can give you a more balanced view of a stock’s valuation.

Why Is the P/E Ratio Important?
The P/E ratio is important because it provides a quick way to assess whether a stock is priced appropriately in relation to its earnings.
- A high P/E ratio may indicate that investors are expecting strong future growth, which is common in high-growth sectors like technology.
- A low P/E ratio, on the other hand, could signal that a stock is undervalued or that the company is facing difficulties.
Investors often use the P/E ratio as a starting point for further analysis. However, it’s important to understand that the P/E ratio alone does not provide a complete picture of a company’s financial health. It should be used alongside other metrics, such as the debt-to-equity ratio, return on equity (ROE), and price-to-sales (P/S) ratio.
What Does a High or Low P/E Ratio Mean?
High P/E Ratio
A high P/E ratio suggests that the market has high expectations for a company’s future growth. For example, technology companies, which often experience rapid growth, typically have high P/E ratios. However, a high P/E ratio can also indicate that the stock is overvalued or in a speculative bubble.
- Tech Stocks: In the tech industry, a P/E ratio above 25 or 30 is not unusual because investors expect the company to grow rapidly.
- Growth Stocks: These companies often have high P/E ratios, as investors are betting on their future earnings potential.
Low P/E Ratio
A low P/E ratio may indicate that a stock is undervalued. However, it could also suggest that the company is in trouble or facing market skepticism. A low P/E ratio might also reflect a temporary dip in earnings, such as during a market correction or an industry-wide downturn.
- Value Stocks: These are typically well-established companies with lower growth potential, often trading at lower P/E ratios.
- Cyclical Stocks: Companies in cyclical industries (e.g., automotive, real estate) may have fluctuating P/E ratios depending on the economic cycle.
How to Use the P/E Ratio in Stock Investment?
The P/E ratio can be a valuable tool in a stock investment strategy, but it’s important to use it in conjunction with other financial metrics.
Comparing P/E Ratios Within an Industry
The P/E ratio is most useful when compared to other companies within the same industry or sector. For example, a P/E of 25 might be reasonable for a high-growth tech company but too high for a utility company.
Evaluating Historical Performance
Compare the company’s current P/E ratio with its historical average. If a company’s P/E ratio is significantly higher than its historical average, it may be overvalued. Conversely, if the P/E ratio is lower than the average, the stock might be undervalued.
Using the P/E Ratio with Other Metrics
To gain a more complete picture, the P/E ratio should be used alongside other financial metrics such as price-to-book (P/B) ratio, return on equity (ROE), dividend yield, free cash flow (FCF).
These metrics can help investors understand the company’s profitability, financial health, and valuation relative to its industry peers.
Conclusion
Shares trading is a powerful way for investors to participate in the financial markets, offering the potential for capital appreciation, dividends, and overall wealth growth. Understanding key financial metrics like the P/E ratio is essential to making informed decisions about which stocks to buy or sell.
By analysing the P/E ratio, investors can gain insights into whether a stock is overvalued or undervalued based on its earnings potential.
Ultima Markets offers an accessible and user-friendly platform for shares trading, where both novice and experienced traders can capitalise on market opportunities. Whether you’re looking to trade stocks in established companies, explore growth stocks, or analyse different market sectors, Ultima Markets provides the tools, resources, and support to help you make informed investment decisions.
Start your trading journey with Ultima Markets today and take advantage of the opportunities available in the world of shares trading. With a robust platform, insightful resources, and comprehensive support, you can make smarter decisions and work towards achieving your financial goals.
FAQs
A good P/E ratio for stocks typically ranges from 10 to 20, depending on the industry and the company’s growth potential.
A P/E ratio below 10 is often considered undervalued, indicating that the stock may be trading below its intrinsic value or facing challenges.
Yes, a P/E ratio of 50 is considered high, suggesting that investors expect significant growth in the company’s future earnings, but it may also signal overvaluation.
Disclaimer: This content is provided for informational purposes only and does not constitute, and should not be construed as, financial, investment, or other professional advice. No statement or opinion contained here in should be considered a recommendation by Ultima Markets or the author regarding any specific investment product, strategy, or transaction. Readers are advised not to rely solely on this material when making investment decisions and should seek independent advice where appropriate.
Latest Articles


FOLLOW US


Ultima Markets is a member of The Financial Commission, an international independent body responsible for resolving disputes in the Forex and CFD markets.
All clients of Ultima Markets are protected under insurance coverage provided by Willis Towers Watson (WTW), a global insurance brokerage established in 1828, with claims eligibility up to US$1,000,000 per account.
Ultima Markets is the first United CFD broker to be part of the United Nations Global Compact.
FOLLOW US
TRADE WITH US
RISK DISCLOSURE
Risk Warning:
Trading leveraged financial products, including Contracts for Difference (CFDs), carries a high level of risk and may result in losses exceeding your initial investment. These products are not suitable for all investors and should only be traded with funds you can afford to lose. You do not own or have any rights to the underlying assets of these derivatives (e.g., entitlement to dividends). Please ensure you fully understand the associated risks. Before trading, consider your level of experience, investment objectives, and seek independent financial advice if necessary. Refer to our legal documents and disclosures before making any trading decisions.
General Advice Warning:
The information provided on this website is general in nature and does not take into account your personal objectives, financial situation, or needs. Before acting on any advice, you should assess its appropriateness in light of your individual circumstances and consult our legal documentation.
Regional Restrictions:
The information and services on this website are not intended for residents of certain jurisdictions, including but not limited to the United States, United Kingdom, Singapore, and any jurisdictions subject to international sanctions. For further information, please contact our customer support team.
Regulatory Information:
Ultima Markets is a trading name shared amongst multiple entities operating in various jurisdictions. These following entities are authorised to operate under the Ultima Markets brand and trademarks.
-
Ultima Markets UK Limited, reference number 470325, is authorised and regulated by the Financial Conduct Authority (FCA). Registered address: 1 Blossom Yard, Fourth Floor, London, E1 6RS, UNITED KINGDOM.
-
Ultima Markets Ltd is authorised and regulated by the Financial Services Commission (FSC) of Mauritius as a Full-Service Investment Dealer (excluding Underwriting), under licence number GB 23201593.
Registered address: 2nd Floor, The Catalyst, 40 Silicon Avenue, Ebene Cybercity, 72201, Mauritius.
-
Ultima Markets EU OÜ, incorporated in Estonia with registry code 17134727. Registered address: Harju maakond, Tallinn, Kristiine linnaosa, Seebi tn 1-1501, 11316. This entity does not offer regulated financial products or provide trading services.
Copyright © 2026 Ultima Markets Ltd. All rights reserved.
-

Messenger


Continue on Messenger
Take the conversation to your Messenger account. You can return anytime.
Scan the QR code and then send the message that appears in your Messenger.
Open Messenger on this device.
-

Instagram

Continue on Instagram
Take the conversation to your Instagram account. You can return anytime.
Scan the QR code to open Instagram. Follow @ultima_markets to send a DM.
Open Instagram on this device.
-

Live Chat
-
