
Ultima Markets App
Trade Anytime, Anywhere
Important Information
This website is managed by Ultima Markets’ international entities, and it’s important to emphasise that they are not subject to regulation by the FCA in the UK. Therefore, you must understand that you will not have the FCA’s protection when investing through this website – for example:
- You will not be guaranteed Negative Balance Protection
- You will not be protected by FCA’s leverage restrictions
- You will not have the right to settle disputes via the Financial Ombudsman Service (FOS)
- You will not be protected by Financial Services Compensation Scheme (FSCS)
- Any monies deposited will not be afforded the protection required under the FCA Client Assets Sourcebook. The level of protection for your funds will be determined by the regulations of the relevant local regulator.
Note: Ultima Markets is currently developing a dedicated website for UK clients and expects to onboard UK clients under FCA regulations in 2026.
If you would like to proceed and visit this website, you acknowledge and confirm the following:
- 1.The website is owned by Ultima Markets’ international entities and not by Ultima Markets UK Ltd, which is regulated by the FCA.
- 2.Ultima Markets Limited, or any of the Ultima Markets international entities, are neither based in the UK nor licensed by the FCA.
- 3.You are accessing the website at your own initiative and have not been solicited by Ultima Markets Limited in any way.
- 4.Investing through this website does not grant you the protections provided by the FCA.
- 5.Should you choose to invest through this website or with any of the international Ultima Markets entities, you will be subject to the rules and regulations of the relevant international regulatory authorities, not the FCA.
Ultima Markets wants to make it clear that we are duly licensed and authorised to offer the services and financial derivative products listed on our website. Individuals accessing this website and registering a trading account do so entirely of their own volition and without prior solicitation.
By confirming your decision to proceed with entering the website, you hereby affirm that this decision was solely initiated by you, and no solicitation has been made by any Ultima Markets entity.
I confirm my intention to proceed and enter this website Please direct me to the website operated by Ultima Markets , regulated by the FCA in the United Kingdom

What Are Higher Highs and Higher Lows?
In the world of trading, recognising trends is one of the most crucial skills a trader can have. One of the most reliable patterns used to identify an uptrend is the concept of higher highs and higher lows.
These two components work together to indicate a bullish market, providing traders with essential information about price direction.
In this article, we’ll explore what higher highs and higher lows are, why they matter, and how traders can use these patterns to improve their trading strategies.
What Are Higher Highs and Higher Lows?
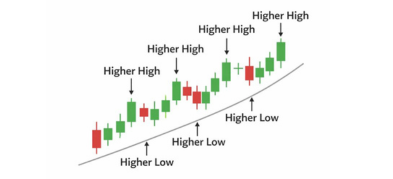
- Higher Highs: A higher high is formed when the price of an asset reaches a new peak that is higher than the previous peak. This indicates that the market is in a bullish trend, with demand outweighing supply.
- Higher Lows: A higher low occurs when the price retraces but does not fall as low as the previous low, forming a base above it. This shows that selling pressure is weakening and the market is maintaining its bullish strength.
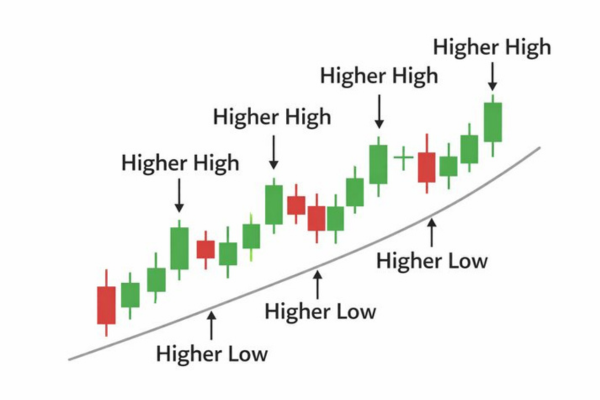
When these two patterns occur together, it signals a continuation of the uptrend, providing traders with opportunities to enter long positions with confidence.
Why Do Higher Highs and Higher Lows Matter?
Understanding the importance of higher highs and higher lows can significantly improve your trading strategy. Here are a few reasons why these patterns are so important:
- Trend Confirmation: Higher highs and higher lows serve as a clear signal of a bullish trend. Traders use this pattern to confirm that the market is in an uptrend, helping them align their trades with the prevailing direction.
- Effective Market Entries: The formation of a higher low presents an ideal entry point. Traders typically buy when the price forms a higher low, entering the market after a pullback but before the trend continues upward.
- Risk Management: By identifying the higher low, traders can set stop-loss orders just below this level, ensuring they’re protected in case the trend reverses unexpectedly.
How to Identify Higher Highs and Higher Lows
Identifying higher highs and higher lows is simple once you know what to look for. Here’s how you can spot this pattern on a price chart:
- Look for Successive Peaks: A higher high occurs when the price makes a new peak above the previous peak. This is a sign that the market is trending upward.
- Find Higher Lows: After each higher high, the price tends to pull back. If the next low is above the previous low, you’ve identified a higher low.
- Trend Continuation: Once you spot a higher high followed by a higher low, you can confirm that the trend is still intact and the market is likely to continue in the bullish direction.
Why Is This Pattern So Important for Traders?
- Clear Trend Confirmation: Higher highs and higher lows give traders a clear indication that the market is bullish, making it easier to decide when to enter or exit trades.
- Ideal Entry Points: Traders often enter the market when the price forms a higher low, providing a favorable entry before the trend moves to the next higher high.
- Better Risk Management: By using the most recent higher low to place a stop-loss, traders can effectively manage their risk while staying aligned with the prevailing trend.
Using Other Indicators to Confirm Higher Highs and Higher Lows
While the pattern of higher highs and higher lows is powerful on its own, combining it with other technical indicators can provide additional confirmation of the trend. Some of the most commonly used indicators include:
- Moving Averages: A price above key moving averages, such as the 50-day or 200-day moving average, can reinforce the bullish trend indicated by higher highs and higher lows.
- RSI (Relative Strength Index): If the RSI is between 40 and 70 during an uptrend, it indicates that the market is strong and not overbought, confirming that the higher highs and higher lows are part of a sustainable trend.
Common Mistakes to Avoid
Even experienced traders can misinterpret the higher highs and higher lows pattern. Here are a few common mistakes to avoid:
- Mistaking Sideways Movement for an Uptrend: Higher highs and higher lows in a narrow range might indicate consolidation rather than a strong trend. Be sure to look for a clear breakout before entering the market.
- Ignoring Timeframes: The pattern can appear on short-term charts, but it’s essential to confirm the trend on longer timeframes to ensure its reliability.
- Overlooking Volume: Volume plays a crucial role in confirming trends. Higher highs and higher lows are more reliable when supported by increasing volume.
How to Trade Using Higher Highs and Higher Lows
- Trend Following Strategy: Enter a long position after the price forms a higher low, aiming to ride the uptrend toward the next higher high.
- Breakout Strategy: If the price breaks above a higher high after a higher low, it can signal a continuation of the uptrend, presenting an opportunity for a breakout trade.
- Trailing Stop Strategy: As the price continues to move upward, use a trailing stop just below each higher low to lock in profits while allowing the trend to run its course.
Comparing Higher Highs and Higher Lows with Higher High Lower Low
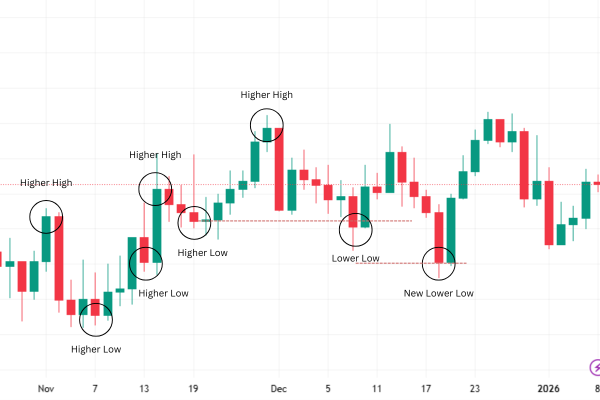
While higher highs and higher lows indicate astrong bullish trend, the concept of higher high and lower low signals the potential beginning of a bearish trend or market reversal.
- Higher High and Lower Low: This pattern can indicate a trend change or uncertainty. A higher high suggests that the price has reached new peaks, but the formation of a lower low signals that selling pressure is building up and could start to outweigh buying momentum. This pattern often points to a shift from bullish to bearish momentum and is crucial for traders who aim to capitalise on market reversals.
Difference in Focus:
- Higher highs and higher lows form a solid foundation for continuing uptrends, while higher high and lower low often signals the end of a bullish trend and the beginning of a bearish one.
If you are looking for more insights into how the higher high and lower low pattern can help you identify market reversals, check out our separate article on trading bearish trends and reversal patterns.
Conclusion
The pattern of higher highs and higher lows is a cornerstone of technical analysis, particularly for trend traders. Recognising these patterns can help you confirm the direction of the market, find optimal entry points, and manage risk effectively.
However, it’s also essential to recognise when trends may shift. Patterns like higher high and lower low could signal the start of a bearish reversal, and understanding this shift is key to staying ahead in the market.
FAQ
Higher highs and higher lows mean price is trending upward. Each new peak is higher than the last, and each pullback low stays higher, confirming an uptrend.
Many traders wait for a pullback to form a higher low, then enter when price starts pushing up again. A common stop-loss is placed below the latest higher low.
A higher high lower low pattern can signal rising volatility or a possible trend shift, because price makes a new high but then breaks below a prior low.
Disclaimer: This content is provided for informational purposes only and does not constitute, and should not be construed as, financial, investment, or other professional advice. No statement or opinion contained here in should be considered a recommendation by Ultima Markets or the author regarding any specific investment product, strategy, or transaction. Readers are advised not to rely solely on this material when making investment decisions and should seek independent advice where appropriate.
Latest Articles
FOLLOW US


Ultima Markets is a member of The Financial Commission, an international independent body responsible for resolving disputes in the Forex and CFD markets.
All clients of Ultima Markets are protected under insurance coverage provided by Willis Towers Watson (WTW), a global insurance brokerage established in 1828, with claims eligibility up to US$1,000,000 per account.
Ultima Markets is the first United CFD broker to be part of the United Nations Global Compact.
FOLLOW US
TRADE WITH US
RISK DISCLOSURE
Risk Warning:
Trading leveraged financial products, including Contracts for Difference (CFDs), carries a high level of risk and may result in losses exceeding your initial investment. These products are not suitable for all investors and should only be traded with funds you can afford to lose. You do not own or have any rights to the underlying assets of these derivatives (e.g., entitlement to dividends). Please ensure you fully understand the associated risks. Before trading, consider your level of experience, investment objectives, and seek independent financial advice if necessary. Refer to our legal documents and disclosures before making any trading decisions.
General Advice Warning:
The information provided on this website is general in nature and does not take into account your personal objectives, financial situation, or needs. Before acting on any advice, you should assess its appropriateness in light of your individual circumstances and consult our legal documentation.
Regional Restrictions:
The information and services on this website are not intended for residents of certain jurisdictions, including but not limited to the United States, United Kingdom, Singapore, and any jurisdictions subject to international sanctions. For further information, please contact our customer support team.
Regulatory Information:
Ultima Markets is a trading name shared amongst multiple entities operating in various jurisdictions. These following entities are authorised to operate under the Ultima Markets brand and trademarks.
-
Ultima Markets UK Limited, reference number 470325, is authorised and regulated by the Financial Conduct Authority (FCA). Registered address: 1 Blossom Yard, Fourth Floor, London, E1 6RS, UNITED KINGDOM.
-
Ultima Markets Ltd is authorised and regulated by the Financial Services Commission (FSC) of Mauritius as a Full-Service Investment Dealer (excluding Underwriting), under licence number GB 23201593.
Registered address: 2nd Floor, The Catalyst, 40 Silicon Avenue, Ebene Cybercity, 72201, Mauritius.
Copyright © 2026 Ultima Markets Ltd. All rights reserved.
-

Messenger


Continue on Messenger
Take the conversation to your Messenger account. You can return anytime.
Scan the QR code and then send the message that appears in your Messenger.
Open Messenger on this device.
-

Instagram

Continue on Instagram
Take the conversation to your Instagram account. You can return anytime.
Scan the QR code to open Instagram. Follow @ultima_markets to send a DM.
Open Instagram on this device.
-

Live Chat
-
