This website is managed by Ultima Markets’ international entities, and it’s important to emphasise that they are not subject to regulation by the FCA in the UK. Therefore, you must understand that you will not have the FCA’s protection when investing through this website – for example:
You will not be guaranteed Negative Balance Protection
You will not be protected by FCA’s leverage restrictions
You will not have the right to settle disputes via the Financial Ombudsman Service (FOS)
You will not be protected by Financial Services Compensation Scheme (FSCS)
Any monies deposited will not be afforded the protection required under the FCA Client Assets Sourcebook. The level of protection for your funds will be determined by the regulations of the relevant local regulator.
Note: UK clients are kindly invited to visit https://www.ultima-markets.co.uk/. Ultima Markets UK expects to begin onboarding UK clients in accordance with FCA regulatory requirements in 2026.
If you would like to proceed and visit this website, you acknowledge and confirm the following:
1.The website is owned by Ultima Markets’ international entities and not by Ultima Markets UK Ltd, which is regulated by the FCA.
2.Ultima Markets Limited, or any of the Ultima Markets international entities, are neither based in the UK nor licensed by the FCA.
3.You are accessing the website at your own initiative and have not been solicited by Ultima Markets Limited in any way.
4.Investing through this website does not grant you the protections provided by the FCA.
5.Should you choose to invest through this website or with any of the international Ultima Markets entities, you will be subject to the rules and regulations of the relevant international regulatory authorities, not the FCA.
Ultima Markets wants to make it clear that we are duly licensed and authorised to offer the services and financial derivative products listed on our website. Individuals accessing this website and registering a trading account do so entirely of their own volition and without prior solicitation.
By confirming your decision to proceed with entering the website, you hereby affirm that this decision was solely initiated by you, and no solicitation has been made by any Ultima Markets entity.
Discover how to identify and trade the tweezer bottom candlestick pattern. A complete guide with strategies, confirmation tools, and real market examples
Not all reversal signals require complex setups or a wall of indicators. Some are clean, visual, and fast to read on any chart. The tweezer bottom is exactly that kind of pattern. It forms over just two candles, appears across all major markets, and tells a clear story about where buying pressure is beginning to outweigh selling.
In this guide, we cover everything you need to know about identifying it, confirming it, and trading it effectively.
What Is a Tweezer Bottom?
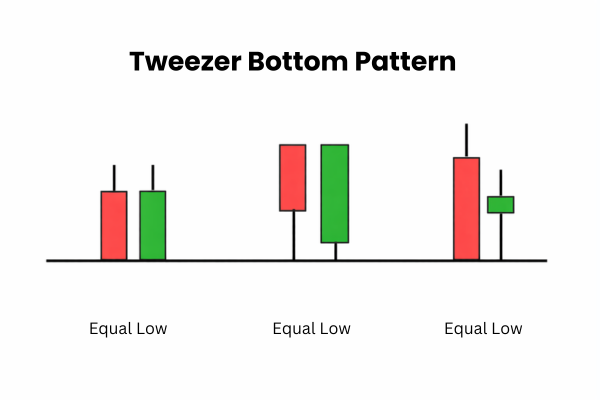
The tweezer bottom is a two-candle candlestick pattern that forms at the end of a downtrend. Both candles share matching or near-identical lows, signalling that sellers have twice attempted to push price lower and failed on both occasions. The name comes from the visual resemblance the two side-by-side candles have to a pair of tweezers, appearing to grip the same price level from below.
The concept was popularised by Steve Nison in his book Japanese Candlestick Charting Techniques, and it remains one of the most widely taught price action signals in technical analysis today.
The core logic is simple: if the market tests a low, bounces, tests it again, and holds, there is a meaningful chance that a floor is forming.
How to Identify the Pattern
A valid tweezer bottom has a specific set of criteria. The market must be in a clear downtrend before the pattern forms.
First Candle
The first candle must be bearish, reflecting continued selling pressure, ideally with a large body that shows strong conviction from sellers.
Second Candle
The second candle must be bullish, showing that buyers have stepped in at the same level. Crucially, both candles must share the same low or come very close to it.
A useful quality filter to apply here is the midpoint rule. If the second candle closes above the midpoint of the first candle’s body, the reversal signal is considered stronger. It shows that buyers have not just entered the market but have done so with enough force to recover more than half of the previous candle’s losses.
The matching lows are most commonly seen in the lower wicks of both candles, though the pattern can also form through the candle bodies when there is little to no wick present. The lows do not need to be a pixel-perfect match.
A small difference of a few pips or points is acceptable, provided the overall structure of the pattern is clear.
The Psychology Behind It
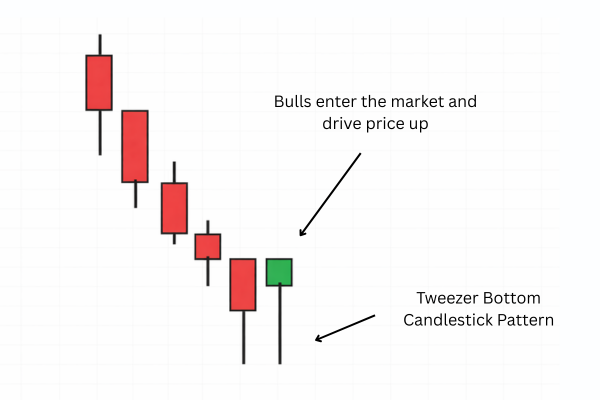
The first candle shows sellers still in control, driving price down with conviction. The second candle tells a different story. Bears attempt to push lower again, but buyers absorb that pressure and close the candle higher, defending the same level for the second time.
Two consecutive rejections at the same price creates a visible floor. When price action builds that kind of structure, it attracts further buying interest, and that is what drives the reversal higher.
Confirmation Tools to Use Before Entering
Spotting the pattern is only the first step. The tweezer bottom should never be traded in isolation, as confirmation is what separates a genuine reversal from a brief pause before price continues lower.
Volume is one of the most reliable confirming signals. A rising volume reading on the second bullish candle suggests that buyers are entering with real conviction rather than a brief flicker of interest. RSI adds useful context as well.
When the pattern forms while the RSI is below 30, the asset is in oversold territory, which increases the probability that a recovery is due. A bullish MACD crossover forming around the same time gives additional confidence that momentum is shifting in favour of buyers.
Multi-timeframe analysis rounds out the toolkit. A tweezer bottom on the 4-hour chart carries more credibility when the daily or weekly chart is also showing oversold conditions or sitting at a significant support level. The higher the timeframe agreement, the more reliable the signal tends to be.
How to Trade the Tweezer Bottom
There are a few reliable approaches depending on your trading style. The most straightforward is trading pullbacks within an established uptrend. When price retraces to a key level and the tweezer bottom forms there, it often marks the end of the correction and the beginning of the next move higher. This keeps the trade aligned with the dominant trend, which improves the risk-to-reward profile considerably.
Combining the pattern with horizontal support or resistance zones is another effective strategy. When the matching lows of the tweezer formation land directly on a known support level, the signal carries significantly more weight. The same applies when the pattern appears at a Fibonacci retracement level such as 38.2%, 50%, or 61.8%, as the confluence of two independent signals pointing to the same zone strengthens the case for a reversal.
For entry, wait for the second candle to close fully before acting. Entering before the close leaves you exposed if the pattern does not hold. Place your stop loss just below the shared lows of both candles. For take profit, target the nearest resistance zone or apply a minimum 1:2 risk-to-reward ratio as a baseline.
How It Compares to Similar Patterns
The tweezer bottom is one of several bullish reversal patterns traders use. Understanding how it differs from the others helps you apply each one in the right context.
Pattern
Candles
Key Feature
Tweezer Bottom
2
Matching lows after a downtrend
Bullish Engulfing
2
Second candle fully engulfs the first
Morning Star
3
Small middle candle signals indecision
Piercing Line
2
Second candle closes above midpoint of first
The tweezer bottom is often the quickest to identify visually, which makes it a practical first-scan pattern when reviewing multiple charts.
However, patterns like the Morning Star or Bullish Engulfing tend to carry slightly more weight individually due to the strength of their candle structure. Using the tweezer bottom with confluence factors closes that gap considerably.
Limitations to Be Aware Of
No candlestick pattern is reliable in every condition, and the tweezer bottom is no exception. In ranging or choppy markets, matching lows can appear frequently without leading to any meaningful reversal. The pattern is also less dependable on lower timeframes such as the 5-minute or 15-minute chart, where noise tends to generate false signals more often.
The absence of a prior downtrend is another red flag. Without that context, two candles sharing the same low is not a reversal signal at all. Always confirm there is a clear directional move preceding the pattern before considering an entry.
A failed tweezer bottom, where price breaks below the shared lows on the following candle, typically signals that the downtrend is continuing with strength and should be treated as a cue to stay out rather than a reason to hold.
Conclusion
The tweezer bottom is a practical, accessible price action pattern that rewards traders who apply it with discipline and context. Its strength lies not in complexity but in the clarity of what it communicates: two failed attempts by sellers at the same level, followed by buyers reclaiming control.
With a base success rate of 56 to 60 percent that improves meaningfully with proper confluence, it is a genuine addition to any trader’s technical toolkit. Apply it at key support levels, confirm it with volume and momentum indicators, and always wait for the second candle to close before entering a trade.
At Ultima Markets, you have access to advanced charting tools designed to help you identify patterns like this quickly and accurately across forex, indices, commodities, and more.
FAQs
What does a tweezer bottom indicate?
It signals a potential bullish reversal, showing that sellers have failed twice at the same low and buyers are beginning to take control.
How reliable is the tweezer bottom pattern?
It carries a base success rate of 56 to 60 percent, improving when confirmed with volume, RSI oversold readings, and formation at a known support level.
Can the tweezer bottom be used in forex and crypto markets?
Yes. It works across all liquid markets including forex, stocks, indices, commodities, and crypto.
Disclaimer: This content is provided for informational purposes only and does not constitute, and should not be construed as, financial, investment, or other professional advice. No statement or opinion contained here in should be considered a recommendation by Ultima Markets or the author regarding any specific investment product, strategy, or transaction. Readers are advised not to rely solely on this material when making investment decisions and should seek independent advice where appropriate.
Thank you for visiting the Ultima Markets website. Please note that this website is intended for individuals residing in jurisdictions where accessing is permitted by law. Ultima and its affiliated entities do not operate in your home jurisdictions.
By clicking on ''Acknowledge'', you confirm that you are entering this website solely based on your initiative and not as a result of any specific marketing outreach. You wish to obtain information from this website based on reverse solicitation principles, in accordance with the applicable laws of your home jurisdiction.