Important Information
This website is managed by Ultima Markets’ international entities, and it’s important to emphasise that they are not subject to regulation by the FCA in the UK. Therefore, you must understand that you will not have the FCA’s protection when investing through this website – for example:
- You will not be guaranteed Negative Balance Protection
- You will not be protected by FCA’s leverage restrictions
- You will not have the right to settle disputes via the Financial Ombudsman Service (FOS)
- You will not be protected by Financial Services Compensation Scheme (FSCS)
- Any monies deposited will not be afforded the protection required under the FCA Client Assets Sourcebook. The level of protection for your funds will be determined by the regulations of the relevant local regulator.
Note: UK clients are kindly invited to visit https://www.ultima-markets.co.uk/. Ultima Markets UK expects to begin onboarding UK clients in accordance with FCA regulatory requirements in 2026.
If you would like to proceed and visit this website, you acknowledge and confirm the following:
- 1.The website is owned by Ultima Markets’ international entities and not by Ultima Markets UK Ltd, which is regulated by the FCA.
- 2.Ultima Markets Limited, or any of the Ultima Markets international entities, are neither based in the UK nor licensed by the FCA.
- 3.You are accessing the website at your own initiative and have not been solicited by Ultima Markets Limited in any way.
- 4.Investing through this website does not grant you the protections provided by the FCA.
- 5.Should you choose to invest through this website or with any of the international Ultima Markets entities, you will be subject to the rules and regulations of the relevant international regulatory authorities, not the FCA.
Ultima Markets wants to make it clear that we are duly licensed and authorised to offer the services and financial derivative products listed on our website. Individuals accessing this website and registering a trading account do so entirely of their own volition and without prior solicitation.
By confirming your decision to proceed with entering the website, you hereby affirm that this decision was solely initiated by you, and no solicitation has been made by any Ultima Markets entity.
I confirm my intention to proceed and enter this website Please direct me to the website operated by Ultima Markets , regulated by the FCA in the United Kingdom
Ultima Markets App
Trade Anytime, Anywhere


Trading with a Reversal Flag Pattern
In strict technical analysis, a flag is a continuation pattern. Traders sometimes use the reversal flag pattern, or also known as reversal flag informally to describe a small flag-like consolidation late in a trend that then breaks in the opposite direction. Think of it as a compact counter-trend pause that hints at momentum fatigue and a possible turn.
Visually you will see a brief rectangle or gentle channel tilting against the prevailing move. Price compresses, ranges narrow, and then a decisive close against the prior trend signals the shift.
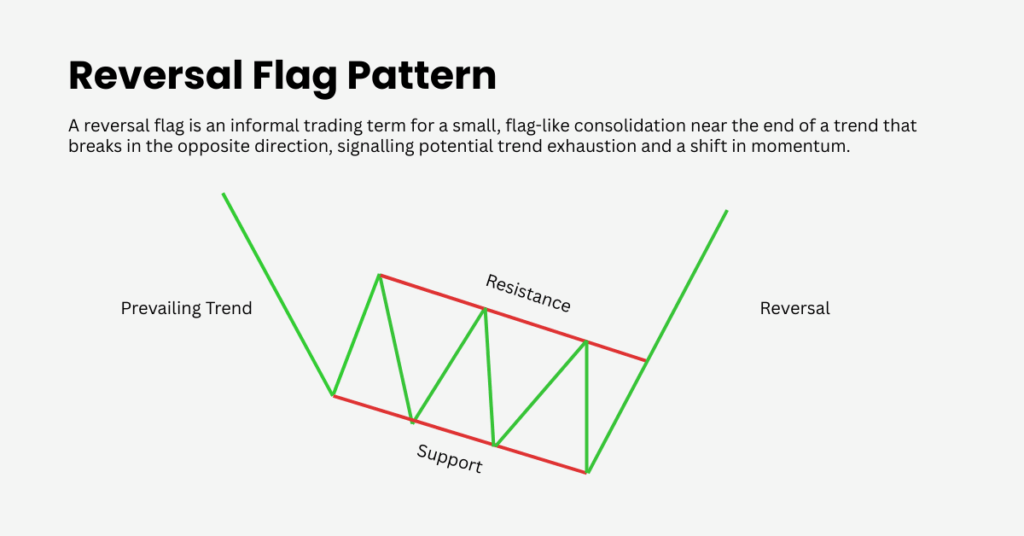
How to Identify a Reversal Flag Pattern
A clean setup usually shows a clear, extended lead-in trend that’s already tiring (slowing momentum or divergence). The consolidation is tight and orderly, tilting against the prior move with overlapping candles and reduced range; it should look compact, not a long base.
Volume and volatility typically dry up inside the channel and expand on the breakout. Confirmation comes from a decisive close outside the channel against the prior trend; a quick retest of the broken boundary often appears and can offer a cleaner entry.
Example
Price slides from 50 to 40, then drifts higher inside a tight 40 to 42 channel with shrinking ranges. A strong close above 42 with higher volume signals sellers are exhausted and a bullish reversal may be underway.
Reversal Flag vs. Bull and Bear Flags
At first glance, reversal flags can look similar to continuation flags, and this is where traders often get confused. The difference lies in context.
A bull flag, for example, forms during an uptrend. After a strong rally, the market consolidates in a downward-sloping channel before breaking higher and continuing the trend. A bear flag follows the same logic in a downtrend, with consolidation against the move before another leg lower. Both are continuation patterns.
The reversal flag, on the other hand, appears when a trend is running out of steam. Instead of extending the move, the breakout points in the opposite direction. Recognising this distinction is essential: a continuation flag reinforces the current trend, while a reversal flag signals a potential turning point.
The Psychology Behind Reversal Flags
Reversal flags are more than just chart formations, they are a reflection of shifting trader sentiment. When a reversal flag develops, it often means that the dominant side of the market is losing conviction.
In a downtrend, sellers may start taking profits while buyers cautiously step in, creating a temporary counter-trend channel. This pause shows that the strong momentum that drove the trend is beginning to weaken.
The breakout is where psychology turns into action. A decisive move against the prevailing trend, especially on high volume, indicates that sentiment has flipped and that traders are ready to push the market in a new direction. In this way, reversal flags capture the transition from one dominant mindset to another.
Trading Strategies with Reversal Flags
Traders generally seek confirmation before acting on a reversal flag. Volume is one of the most important factors. A breakout backed by strong participation is far more reliable than one occurring on weak volume.
Many traders choose to enter positions at the breakout point, placing stop-loss orders just beyond the opposite side of the flag to manage risk. Profit targets are often set by measuring the height of the flagpole and projecting that distance from the breakout.
For example, if a stock falls from $50 to $40 (flagpole), consolidates between $40 and $42 (flag), and then breaks out above $42 on strong volume, traders may aim for a price target of $46 to $48.
Limitations of the Reversal Flag Pattern
Like all technical setups, reversal flags are not foolproof. False breakouts are common, especially in volatile markets where price swings can trap traders on the wrong side. The pattern is most effective when used alongside other tools such as moving averages, RSI, or key support and resistance levels. By combining signals, traders can filter out noise and strengthen their decision-making.
Final Thoughts
The reversal flag pattern can be a powerful signal for traders seeking to identify market turning points. While it shares similarities with continuation flags, its meaning is very different. Understanding the psychology behind the pattern, confirming signals with volume, and applying disciplined risk management can make reversal flags a valuable part of any trading strategy.
Disclaimer: This content is provided for informational purposes only and does not constitute, and should not be construed as, financial, investment, or other professional advice. No statement or opinion contained here in should be considered a recommendation by Ultima Markets or the author regarding any specific investment product, strategy, or transaction. Readers are advised not to rely solely on this material when making investment decisions and should seek independent advice where appropriate.
Latest Articles


FOLLOW US


Ultima Markets is a member of The Financial Commission, an international independent body responsible for resolving disputes in the Forex and CFD markets.
All clients of Ultima Markets are protected under insurance coverage provided by Willis Towers Watson (WTW), a global insurance brokerage established in 1828, with claims eligibility up to US$1,000,000 per account.
Ultima Markets is the first United CFD broker to be part of the United Nations Global Compact.
FOLLOW US
TRADE WITH US
RISK DISCLOSURE
Risk Warning:
Trading leveraged financial products, including Contracts for Difference (CFDs), carries a high level of risk and may result in losses exceeding your initial investment. These products are not suitable for all investors and should only be traded with funds you can afford to lose. You do not own or have any rights to the underlying assets of these derivatives (e.g., entitlement to dividends). Please ensure you fully understand the associated risks. Before trading, consider your level of experience, investment objectives, and seek independent financial advice if necessary. Refer to our legal documents and disclosures before making any trading decisions.
General Advice Warning:
The information provided on this website is general in nature and does not take into account your personal objectives, financial situation, or needs. Before acting on any advice, you should assess its appropriateness in light of your individual circumstances and consult our legal documentation.
Regional Restrictions:
The information and services on this website are not intended for residents of certain jurisdictions, including but not limited to the United States, United Kingdom, Singapore, and any jurisdictions subject to international sanctions. For further information, please contact our customer support team.
Regulatory Information:
Ultima Markets is a trading name shared amongst multiple entities operating in various jurisdictions. These following entities are authorised to operate under the Ultima Markets brand and trademarks.
-
Ultima Markets UK Limited, reference number 470325, is authorised and regulated by the Financial Conduct Authority (FCA). Registered address: 1 Blossom Yard, Fourth Floor, London, E1 6RS, UNITED KINGDOM.
-
Ultima Markets Ltd is authorised and regulated by the Financial Services Commission (FSC) of Mauritius as a Full-Service Investment Dealer (excluding Underwriting), under licence number GB 23201593.
Registered address: 2nd Floor, The Catalyst, 40 Silicon Avenue, Ebene Cybercity, 72201, Mauritius.
-
Ultima Markets EU OÜ, incorporated in Estonia with registry code 17134727. Registered address: Harju maakond, Tallinn, Kristiine linnaosa, Seebi tn 1-1501, 11316. This entity does not offer regulated financial products or provide trading services.
Copyright © 2026 Ultima Markets Ltd. All rights reserved.
-

Messenger


Continue on Messenger
Take the conversation to your Messenger account. You can return anytime.
Scan the QR code and then send the message that appears in your Messenger.
Open Messenger on this device.
-

Instagram

Continue on Instagram
Take the conversation to your Instagram account. You can return anytime.
Scan the QR code to open Instagram. Follow @ultima_markets to send a DM.
Open Instagram on this device.
-

Live Chat
-
