
Ultima Markets App
Trade Anytime, Anywhere
Important Information
This website is managed by Ultima Markets’ international entities, and it’s important to emphasise that they are not subject to regulation by the FCA in the UK. Therefore, you must understand that you will not have the FCA’s protection when investing through this website – for example:
- You will not be guaranteed Negative Balance Protection
- You will not be protected by FCA’s leverage restrictions
- You will not have the right to settle disputes via the Financial Ombudsman Service (FOS)
- You will not be protected by Financial Services Compensation Scheme (FSCS)
- Any monies deposited will not be afforded the protection required under the FCA Client Assets Sourcebook. The level of protection for your funds will be determined by the regulations of the relevant local regulator.
Note: Ultima Markets is currently developing a dedicated website for UK clients and expects to onboard UK clients under FCA regulations in 2026.
If you would like to proceed and visit this website, you acknowledge and confirm the following:
- 1.The website is owned by Ultima Markets’ international entities and not by Ultima Markets UK Ltd, which is regulated by the FCA.
- 2.Ultima Markets Limited, or any of the Ultima Markets international entities, are neither based in the UK nor licensed by the FCA.
- 3.You are accessing the website at your own initiative and have not been solicited by Ultima Markets Limited in any way.
- 4.Investing through this website does not grant you the protections provided by the FCA.
- 5.Should you choose to invest through this website or with any of the international Ultima Markets entities, you will be subject to the rules and regulations of the relevant international regulatory authorities, not the FCA.
Ultima Markets wants to make it clear that we are duly licensed and authorised to offer the services and financial derivative products listed on our website. Individuals accessing this website and registering a trading account do so entirely of their own volition and without prior solicitation.
By confirming your decision to proceed with entering the website, you hereby affirm that this decision was solely initiated by you, and no solicitation has been made by any Ultima Markets entity.
I confirm my intention to proceed and enter this website Please direct me to the website operated by Ultima Markets , regulated by the FCA in the United Kingdom

What Is the Three Black Crows Pattern?
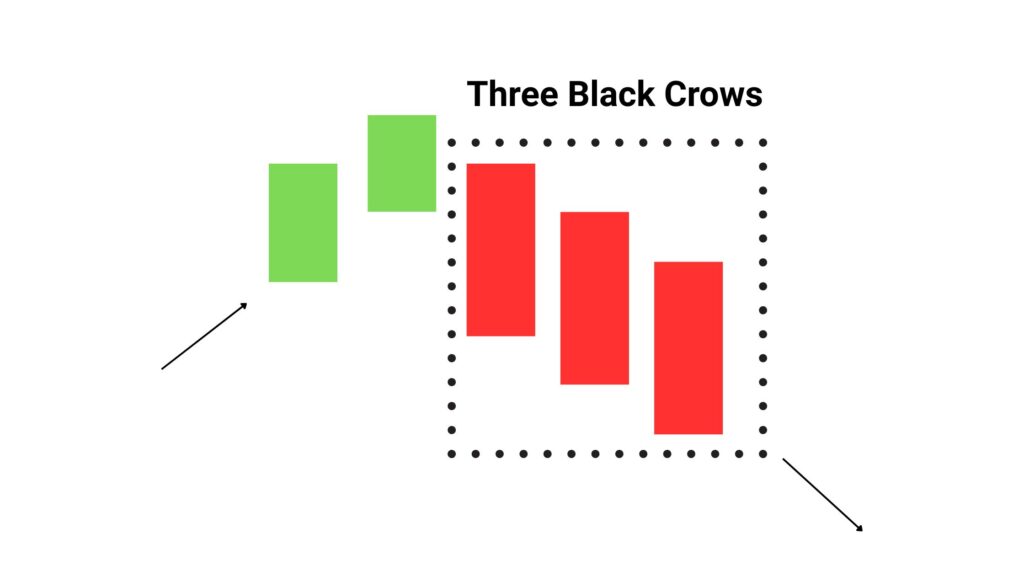
The three black crows pattern is commonly referred to in technical analysis as the three black crows pattern. It is a well-known bearish reversal candlestick formation. It appears at the top of an uptrend and signals a shift in momentum from bullish to bearish.
This pattern consists of three consecutive long-bodied bearish candles, each one:
- Opening within or near the previous candle’s real body
- Closing lower than the previous session
- Having little or no lower shadows, showing strong selling pressure
This visual structure reflects increasing bearish control over the market, warning traders of a potential trend reversal.
Three Black Crows Pattern Meaning in Trading
The three black crows pattern meaning highlights a gradual loss of buying pressure, often after a strong rally. In trader terms, it tells us:
- Buyers are failing to maintain highs
- Bears are stepping in with conviction
- The pattern suggests the beginning of a downtrend or correction
However, professional traders always confirm the pattern with additional indicators, such as:
- Relative Strength Index (RSI): dropping below 50 indicates fading momentum
- MACD crossover: a bearish crossover strengthens the signal
- Volume: increasing volume adds validity to the pattern
Three Black Crows Pattern Example
Example: Tesla Inc. (TSLA)
Imagine Tesla has rallied for several weeks and then prints the following on its daily chart:
- Day 1: A large red candle closes below the previous green candle
- Day 2: Another bearish candle opens within Day 1’s body and closes lower
- Day 3: A third red candle with a lower close, minimal shadow
This forms a three black crows pattern, suggesting a shift in sentiment and potential short-term price correction.
Three Black Crows Pattern Strategy
Entry Signal
- Enter short after the third candle closes
- Confirm with RSI < 50, MACD crossover, or bearish divergence
Stop Loss
- Set above the high of the first candle in the pattern
Take Profit
- Target the nearest support level
- Use Fibonacci retracements or ATR for dynamic profit targets
This strategy is especially useful for swing traders and forex traders who are looking to ride short-term reversals.
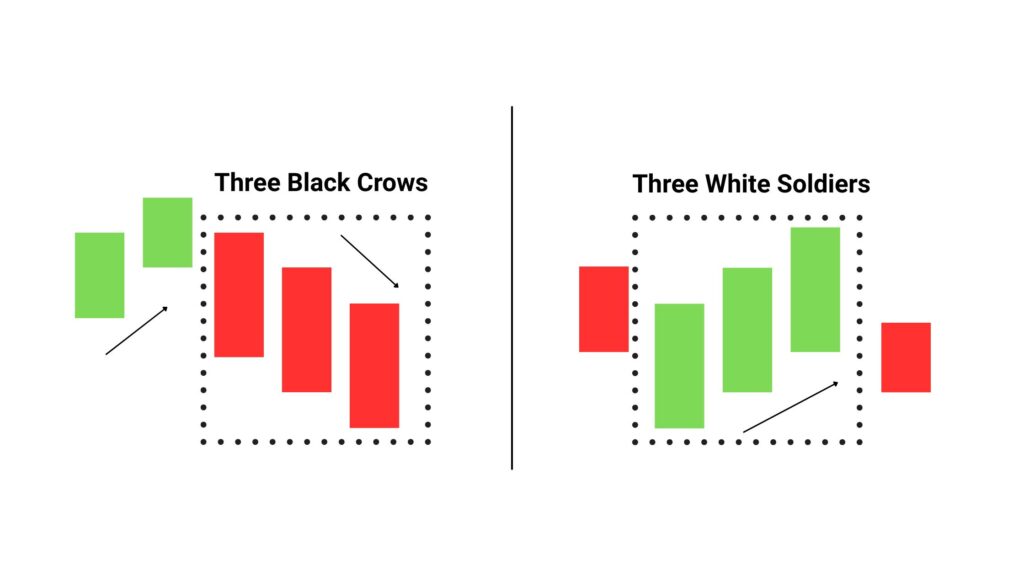
Three Black Crows vs Three White Soldiers
Both are reversal patterns but serve opposite purposes. Recognizing which one appears helps traders position trades accordingly.
| Feature | Three Black Crows | Three White Soldiers |
| Trend Reversal Type | Bearish | Bullish |
| Candlestick Color | Red or black | Green or white |
| Position in Chart | After an uptrend | After a downtrend |
| Implication | Selling pressure increasing | Buying pressure increasing |
Limitations of Using the Three Black Crows Pattern
Despite its strength, the three black crows pattern has some limitations:
- False Signals in sideways or low-volume markets
- Lagging Entry: by the third candle, a significant move may have already occurred
- Overreliance Risk: Using it without confirmation from momentum or volume indicators can lead to false entries
Hence, seasoned traders combine this with broader technical and macroeconomic signals.
Real World Example of Three Black Crows
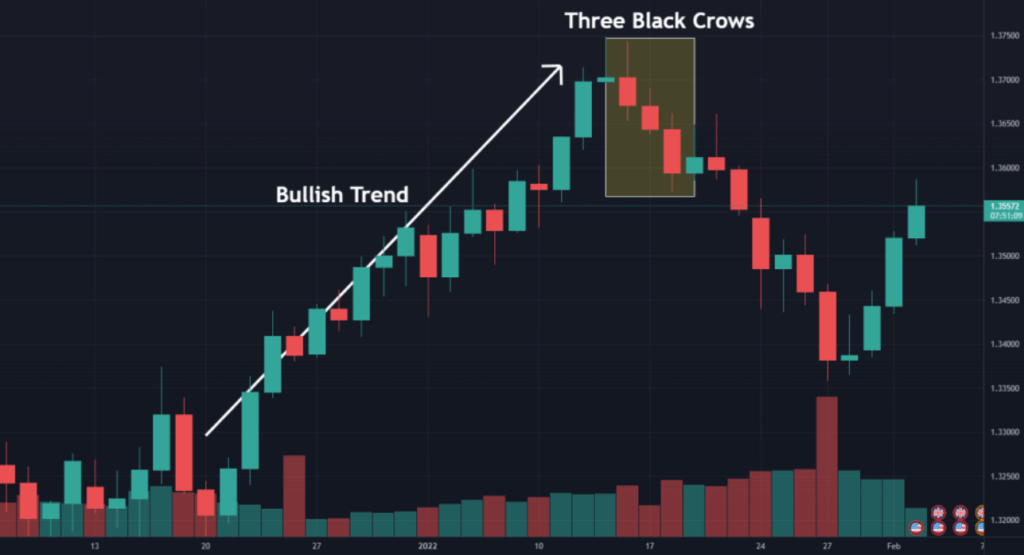
In August 2023, the S&P 500 Index showed a textbook three black crows pattern on the daily chart following a prolonged bullish phase. It coincided with poor earnings data and rising bond yields, triggering a 5% correction over two weeks.
This setup was confirmed by MACD divergence and RSI breaching the 50 mark, classic signals used by institutional traders.
Application in Forex: Krona USD Forecast
The three black crows pattern can also appear in major forex pairs like USD/SEK. For example, if the pair rallies sharply and prints three bearish candles at resistance, it may signal a reversal.
| Timeframe | Forecasted USD/SEK |
| Q3 2025 (Sept) | 9.42 |
| Q4 2025 (Dec) | 9.29-9.35 |
| Q1 2026 (Mar) | 9.00 |
Analysts from ExchangeRates.org.uk and PandaForecast expect the Swedish Krona to strengthen gradually into 2026. The USD/SEK pair is projected to fall from ~9.55 in July to as low as 9.00 by March 2026, driven by weakening USD sentiment and improving Swedish macro fundamentals.
Using the three black crows pattern on the USD/SEK chart at technical resistance could offer bearish trading setups aligned with this macro trend.
Conclusion
The three black crows pattern widely known as three black crows is a powerful bearish reversal signal that can guide traders across equities and forex. When combined with volume analysis, momentum indicators, and macro data like the USD/SEK forecast, it becomes a robust tool for high-probability trades.
Ultima Markets provides advanced charting and trade execution tools to help you identify candlestick patterns like the three black crows in real time. Trade smarter with institutional-grade insights.
Disclaimer: This content is provided for informational purposes only and does not constitute, and should not be construed as, financial, investment, or other professional advice. No statement or opinion contained here in should be considered a recommendation by Ultima Markets or the author regarding any specific investment product, strategy, or transaction. Readers are advised not to rely solely on this material when making investment decisions and should seek independent advice where appropriate.
Latest Articles


FOLLOW US


Ultima Markets is a member of The Financial Commission, an international independent body responsible for resolving disputes in the Forex and CFD markets.
All clients of Ultima Markets are protected under insurance coverage provided by Willis Towers Watson (WTW), a global insurance brokerage established in 1828, with claims eligibility up to US$1,000,000 per account.
Ultima Markets is the first United CFD broker to be part of the United Nations Global Compact.
FOLLOW US
TRADE WITH US
RISK DISCLOSURE
Risk Warning:
Trading leveraged financial products, including Contracts for Difference (CFDs), carries a high level of risk and may result in losses exceeding your initial investment. These products are not suitable for all investors and should only be traded with funds you can afford to lose. You do not own or have any rights to the underlying assets of these derivatives (e.g., entitlement to dividends). Please ensure you fully understand the associated risks. Before trading, consider your level of experience, investment objectives, and seek independent financial advice if necessary. Refer to our legal documents and disclosures before making any trading decisions.
General Advice Warning:
The information provided on this website is general in nature and does not take into account your personal objectives, financial situation, or needs. Before acting on any advice, you should assess its appropriateness in light of your individual circumstances and consult our legal documentation.
Regional Restrictions:
The information and services on this website are not intended for residents of certain jurisdictions, including but not limited to the United States, United Kingdom, Singapore, and any jurisdictions subject to international sanctions. For further information, please contact our customer support team.
Regulatory Information:
Ultima Markets is a trading name shared amongst multiple entities operating in various jurisdictions. These following entities are authorised to operate under the Ultima Markets brand and trademarks.
-
Ultima Markets UK Limited, reference number 470325, is authorised and regulated by the Financial Conduct Authority (FCA). Registered address: 1 Blossom Yard, Fourth Floor, London, E1 6RS, UNITED KINGDOM.
-
Ultima Markets Ltd is authorised and regulated by the Financial Services Commission (FSC) of Mauritius as a Full-Service Investment Dealer (excluding Underwriting), under licence number GB 23201593.
Registered address: 2nd Floor, The Catalyst, 40 Silicon Avenue, Ebene Cybercity, 72201, Mauritius.
Copyright © 2026 Ultima Markets Ltd. All rights reserved.
-

Messenger


Continue on Messenger
Take the conversation to your Messenger account. You can return anytime.
Scan the QR code and then send the message that appears in your Messenger.
Open Messenger on this device.
-

Instagram

Continue on Instagram
Take the conversation to your Instagram account. You can return anytime.
Scan the QR code to open Instagram. Follow @ultima_markets to send a DM.
Open Instagram on this device.
-

Live Chat
-
