
Ultima Markets App
Trade Anytime, Anywhere
Important Information
This website is managed by Ultima Markets’ international entities, and it’s important to emphasise that they are not subject to regulation by the FCA in the UK. Therefore, you must understand that you will not have the FCA’s protection when investing through this website – for example:
- You will not be guaranteed Negative Balance Protection
- You will not be protected by FCA’s leverage restrictions
- You will not have the right to settle disputes via the Financial Ombudsman Service (FOS)
- You will not be protected by Financial Services Compensation Scheme (FSCS)
- Any monies deposited will not be afforded the protection required under the FCA Client Assets Sourcebook. The level of protection for your funds will be determined by the regulations of the relevant local regulator.
Note: Ultima Markets is currently developing a dedicated website for UK clients and expects to onboard UK clients under FCA regulations in 2026.
If you would like to proceed and visit this website, you acknowledge and confirm the following:
- 1.The website is owned by Ultima Markets’ international entities and not by Ultima Markets UK Ltd, which is regulated by the FCA.
- 2.Ultima Markets Limited, or any of the Ultima Markets international entities, are neither based in the UK nor licensed by the FCA.
- 3.You are accessing the website at your own initiative and have not been solicited by Ultima Markets Limited in any way.
- 4.Investing through this website does not grant you the protections provided by the FCA.
- 5.Should you choose to invest through this website or with any of the international Ultima Markets entities, you will be subject to the rules and regulations of the relevant international regulatory authorities, not the FCA.
Ultima Markets wants to make it clear that we are duly licensed and authorised to offer the services and financial derivative products listed on our website. Individuals accessing this website and registering a trading account do so entirely of their own volition and without prior solicitation.
By confirming your decision to proceed with entering the website, you hereby affirm that this decision was solely initiated by you, and no solicitation has been made by any Ultima Markets entity.
I confirm my intention to proceed and enter this website Please direct me to the website operated by Ultima Markets , regulated by the FCA in the United Kingdom

The Long Legged Doji Pattern Explained
The Long-Legged Doji is a distinctive candlestick pattern in technical analysis that highlights a moment of market indecision. It forms when there is significant price movement within a trading period, but the open and close are near each other, indicating a stalemate between buyers and sellers.
Recognized for its long shadows (upper and lower wicks), this pattern is essential for traders looking to anticipate potential reversals or pauses in market momentum.
Here, we’ll break down the Long-Legged Doji, how to spot it, and how to incorporate it into your trading strategy.
What Is a Long-Legged Doji?
A Long-Legged Doji is a candlestick pattern where:
- The open and close prices are nearly identical or very close.
- The candlestick has long upper and lower shadows (wicks), indicating significant price movement in both directions during the session.
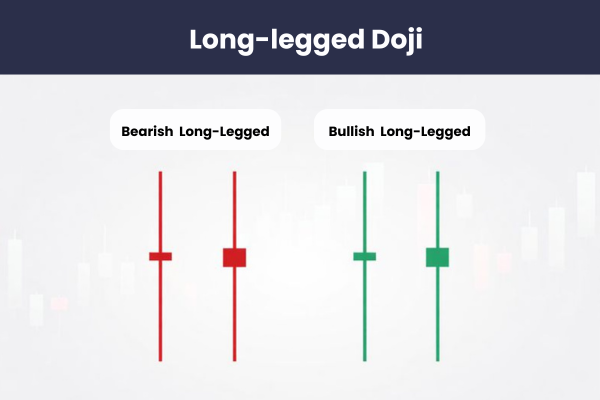
The small body of the Long-Legged Doji and its extended shadows suggest a battle between buyers and sellers that ultimately ends in indecision. The cross or plus sign shape that often results from this pattern reflects this standoff, signaling uncertainty in the market.
This makes the Long-Legged Doji a crucial indicator for traders looking to assess volatility or potential reversals.
Why the Long-Legged Doji Matters to Traders
The Long-Legged Doji candlestick captures the psychology of the market. The long shadows indicate that both bulls and bears were active during the session, pushing the price significantly higher and lower, but neither could maintain control. By the end of the period, the price returned near the open, reflecting market indecision.
This pattern is particularly significant after a strong trend, where it can signal a pause or a potential reversal. The Long-Legged Doji essentially tells traders that momentum may be weakening, and a shift in the direction of price movement could be imminent.
However, it’s important to remember that it is a neutral signal on its own, requiring confirmation from subsequent price action.
How the Long-Legged Doji Forms
The Long-Legged Doji is formed through specific price action. Here’s how it typically plays out:
- The price opens at a certain level.
- Buyers push the price up, creating the upper shadow.
- Sellers then take control, driving the price down, forming the lower shadow.
- Despite these wide price fluctuations, the price eventually closes near the opening price, creating a small body in the middle of the candlestick.
This pattern is most commonly seen during periods of market volatility or when uncertainty is heightened, such as after major news events or following a strong price move.
Where Does the Long-Legged Doji Appear?
The Long-Legged Doji often appears in volatile markets, particularly when:
- After a Strong Trend: It can signal that the current trend (uptrend or downtrend) is losing momentum, possibly leading to a trend reversal.
- Near Key Support or Resistance Levels: The pattern can emerge when price is testing important support or resistance, showing indecision about whether the market will break through or reverse.
- Major News Events: During times of uncertainty, such as earnings reports or economic data releases, the market may exhibit increased volatility, leading to the formation of a Long-Legged Doji.
For this pattern to be more reliable, it’s essential to consider the volume. High volume can suggest that the indecision is meaningful, whereas low volume could indicate that the price movement is insignificant or just market noise.
Long-Legged Doji in Different Market Conditions
The Long-Legged Doji is most impactful when it occurs after a significant trend. Here’s how to interpret the pattern depending on the prevailing market condition:
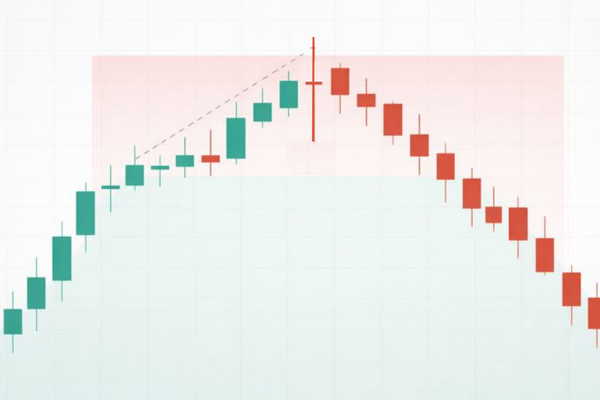
- In an Uptrend: If a Long-Legged Doji forms after a strong uptrend, it may signal that buying pressure is weakening. Sellers are beginning to take control, suggesting that a bearish reversal could be near.
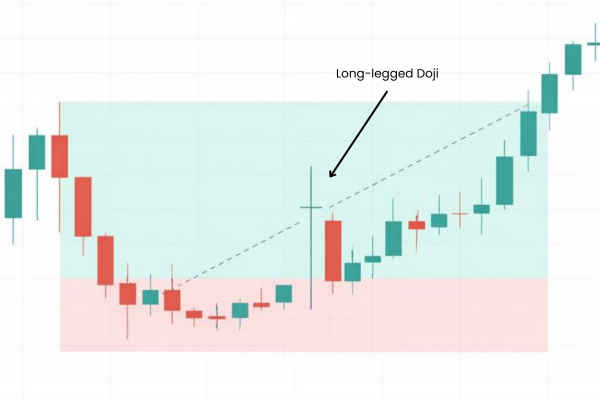
- In a Downtrend: If this pattern forms after a downtrend, it can indicate that selling pressure is fading, and buyers are stepping in, which may lead to a bullish reversal.
- Near Support or Resistance Levels: The context in which the Long-Legged Doji forms is crucial. When it appears near key support or resistance levels, it can provide stronger confirmation of a potential reversal or price reaction at those levels.
The Long-Legged Doji vs Other Doji Patterns
All Doji patterns signal market indecision, but the Long-Legged Doji stands out due to its long shadows. Here’s how it compares to other Doji patterns:
| Doji Pattern | Key Features | Indication |
| Standard Doji | – Small body – Short upper and lower shadows | minimal price movement during the session |
| Dragonfly Doji | – Small body – Long lower shadow, no or very short upper shadow | a bullish reversal after a downtrend. |
| Gravestone Doji | – Small body – Long upper shadow, no or very short lower shadow | signaling a bearish reversal after an uptrend. |
| Long-Legged Doji | – Small body – Long upper and lower shadows | more neutral, requiring confirmation from the next candles to determine its implication. |
How to Use the Long-Legged Doji in Trading
The Long-Legged Doji can signal potential market shifts, but it needs confirmation before traders act. Here’s how to use it effectively:
- Reversal Signal:
- Bullish Reversal: If a Long-Legged Doji forms after a downtrend and the next candlestick closes above the high of the Doji, it may indicate a potential bullish reversal.
- Bearish Reversal: Conversely, if the Doji forms after an uptrend and the next candlestick closes below the low of the Doji, it could signal a bearish reversal.
- Volume Confirmation: Volume plays a crucial role in validating the pattern. A high-volume Doji indicates that the battle between buyers and sellers is meaningful, while a low-volume Doji may be less reliable.
- Support and Resistance: The Long-Legged Doji is especially useful when it appears at support or resistance levels. In such cases, the pattern may signal a potential breakout or price reversal.
- Timeframe: The Long-Legged Doji is more reliable on higher timeframes (such as the daily or 4-hour chart), as it captures a broader market sentiment. On shorter timeframes, it may be less dependable due to increased market noise.
Example of the Long-Legged Doji
Bullish Reversal: Consider a stock in a downtrend with lower lows. A Long-Legged Doji forms at a new low, and the next candle closes higher, signaling the end of the downtrend and the potential start of a bullish reversal.
Bearish Reversal: In an uptrend, a Long-Legged Doji forms at the peak, followed by a bearish candle that closes lower. This may indicate that the bullish momentum is fading and a downtrend could begin.
Limitations of the Long-Legged Doji
Although the Long-Legged Doji is useful, it has its limitations:
- Confirmation Required: It’s a neutral signal on its own. Confirmation from subsequent candlesticks is crucial.
- Low-Volume Conditions: In markets with low volume, the Long-Legged Doji can give false signals and may reflect short-term market noise.
- Market Context: Always assess the pattern in the context of the broader trend, support/resistance levels, and volume.
Conclusion
The Long-Legged Doji is a powerful candlestick pattern that reflects market indecision and volatility. It can signal potential trend reversals when it appears after strong trends, particularly when confirmed by volume and subsequent price action.
However, it’s important to interpret the pattern in the context of the overall market conditions and use additional indicators for confirmation.
By understanding the Long-Legged Doji and combining it with other technical tools, traders can make more informed decisions, potentially improving their trading success.
FAQ
A Long-Legged Doji signals market indecision, showing that both buyers and sellers are in conflict, potentially leading to a reversal or pause in trend.
While the Long-Legged Doji suggests indecision, it’s most reliable when combined with confirmation from other indicators, volume, or trend analysis.
Traders typically wait for confirmation after a Long-Legged Doji forms. A breakout above or below the Doji’s high or low could signal a reversal.
Disclaimer: This content is provided for informational purposes only and does not constitute, and should not be construed as, financial, investment, or other professional advice. No statement or opinion contained here in should be considered a recommendation by Ultima Markets or the author regarding any specific investment product, strategy, or transaction. Readers are advised not to rely solely on this material when making investment decisions and should seek independent advice where appropriate.
Latest Articles
FOLLOW US


Ultima Markets is a member of The Financial Commission, an international independent body responsible for resolving disputes in the Forex and CFD markets.
All clients of Ultima Markets are protected under insurance coverage provided by Willis Towers Watson (WTW), a global insurance brokerage established in 1828, with claims eligibility up to US$1,000,000 per account.
Ultima Markets is the first United CFD broker to be part of the United Nations Global Compact.
FOLLOW US
TRADE WITH US
RISK DISCLOSURE
Risk Warning:
Trading leveraged financial products, including Contracts for Difference (CFDs), carries a high level of risk and may result in losses exceeding your initial investment. These products are not suitable for all investors and should only be traded with funds you can afford to lose. You do not own or have any rights to the underlying assets of these derivatives (e.g., entitlement to dividends). Please ensure you fully understand the associated risks. Before trading, consider your level of experience, investment objectives, and seek independent financial advice if necessary. Refer to our legal documents and disclosures before making any trading decisions.
General Advice Warning:
The information provided on this website is general in nature and does not take into account your personal objectives, financial situation, or needs. Before acting on any advice, you should assess its appropriateness in light of your individual circumstances and consult our legal documentation.
Regional Restrictions:
The information and services on this website are not intended for residents of certain jurisdictions, including but not limited to the United States, United Kingdom, Singapore, and any jurisdictions subject to international sanctions. For further information, please contact our customer support team.
Regulatory Information:
Ultima Markets is a trading name shared amongst multiple entities operating in various jurisdictions. These following entities are authorised to operate under the Ultima Markets brand and trademarks.
-
Ultima Markets UK Limited, reference number 470325, is authorised and regulated by the Financial Conduct Authority (FCA). Registered address: 1 Blossom Yard, Fourth Floor, London, E1 6RS, UNITED KINGDOM.
-
Ultima Markets Ltd is authorised and regulated by the Financial Services Commission (FSC) of Mauritius as a Full-Service Investment Dealer (excluding Underwriting), under licence number GB 23201593.
Registered address: 2nd Floor, The Catalyst, 40 Silicon Avenue, Ebene Cybercity, 72201, Mauritius.
Copyright © 2026 Ultima Markets Ltd. All rights reserved.
-

Messenger


Continue on Messenger
Take the conversation to your Messenger account. You can return anytime.
Scan the QR code and then send the message that appears in your Messenger.
Open Messenger on this device.
-

Instagram

Continue on Instagram
Take the conversation to your Instagram account. You can return anytime.
Scan the QR code to open Instagram. Follow @ultima_markets to send a DM.
Open Instagram on this device.
-

Live Chat
-
