Important Information
This website is managed by Ultima Markets’ international entities, and it’s important to emphasise that they are not subject to regulation by the FCA in the UK. Therefore, you must understand that you will not have the FCA’s protection when investing through this website – for example:
- You will not be guaranteed Negative Balance Protection
- You will not be protected by FCA’s leverage restrictions
- You will not have the right to settle disputes via the Financial Ombudsman Service (FOS)
- You will not be protected by Financial Services Compensation Scheme (FSCS)
- Any monies deposited will not be afforded the protection required under the FCA Client Assets Sourcebook. The level of protection for your funds will be determined by the regulations of the relevant local regulator.
Note: Ultima Markets is currently developing a dedicated website for UK clients and expects to onboard UK clients under FCA regulations in 2026.
If you would like to proceed and visit this website, you acknowledge and confirm the following:
- 1.The website is owned by Ultima Markets’ international entities and not by Ultima Markets UK Ltd, which is regulated by the FCA.
- 2.Ultima Markets Limited, or any of the Ultima Markets international entities, are neither based in the UK nor licensed by the FCA.
- 3.You are accessing the website at your own initiative and have not been solicited by Ultima Markets Limited in any way.
- 4.Investing through this website does not grant you the protections provided by the FCA.
- 5.Should you choose to invest through this website or with any of the international Ultima Markets entities, you will be subject to the rules and regulations of the relevant international regulatory authorities, not the FCA.
Ultima Markets wants to make it clear that we are duly licensed and authorised to offer the services and financial derivative products listed on our website. Individuals accessing this website and registering a trading account do so entirely of their own volition and without prior solicitation.
By confirming your decision to proceed with entering the website, you hereby affirm that this decision was solely initiated by you, and no solicitation has been made by any Ultima Markets entity.
I confirm my intention to proceed and enter this website

The Gravestone Doji Candle Explained
Candlestick patterns are a cornerstone of technical analysis, giving traders insights into shifts in market sentiment. Among the most telling formations is the Gravestone Doji candle, a pattern that often warns of weakening bullish momentum and potential bearish reversals.
First used by Japanese rice traders centuries ago, this candlestick has stood the test of time and remains one of the most recognisable signals in modern trading.
What Is a Gravestone Doji Candle?
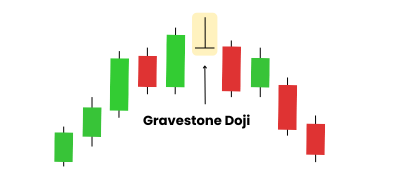
The Gravestone Doji forms when the open, low, and close prices are all at or near the same level, while the session’s high is much higher. This creates a distinctive shape that looks like an upside-down capital “T.”
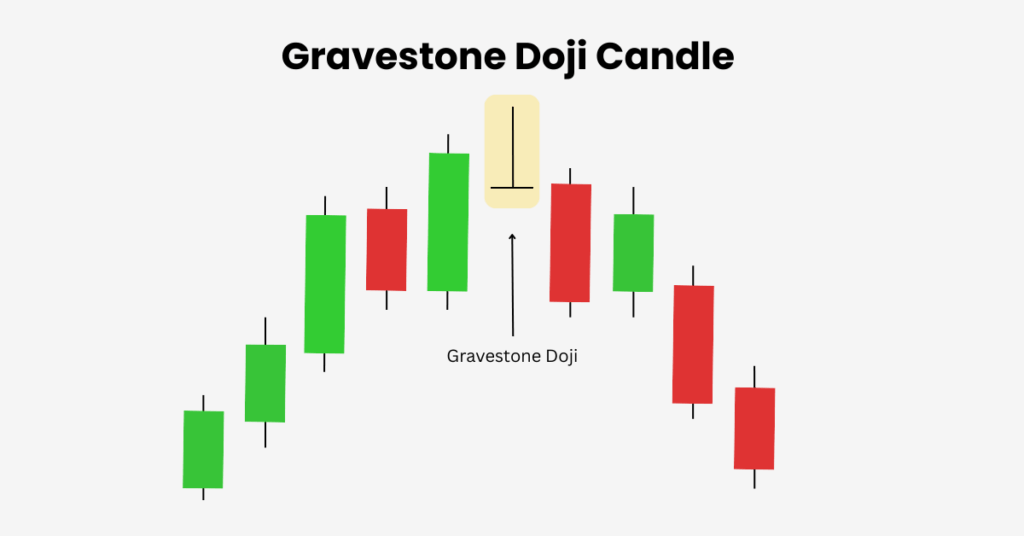
The psychology behind the candle is straightforward. Buyers initially push the price upward with strong momentum, but sellers regain control at resistance and force the price back down. By the close, the session ends near where it began, leaving behind a long upper shadow. This failed bullish attempt is why the Gravestone Doji is widely regarded as a bearish signal.
How to Recognise a Gravestone Doji
On a candlestick chart, the Gravestone Doji is easy to identify. It features a long upper shadow, virtually no lower shadow, and a flat base where the open, low, and close cluster together. The pattern tends to stand out most clearly when it forms near resistance levels or at the top of a strong uptrend.
What Does It Mean in Trading?
The Gravestone Doji reflects a battle between buyers and sellers that ends with bearish control. It is often interpreted as an early warning of a trend reversal when spotted at resistance or after an extended bullish run. At times, it also signals the end of a short-term pullback within a broader downtrend, indicating that bullish rallies are losing strength.
While it is considered bearish in nature, the Gravestone Doji is not foolproof. Traders look for confirmation from the following candles before acting on the signal.
Where Does It Appear?
This pattern most frequently shows up at resistance zones where price struggles to push higher. It is most reliable after a strong uptrend, where its appearance hints at trend exhaustion. The Gravestone Doji can also occur during consolidation phases, serving as a momentum pause candle. On higher timeframes like daily or weekly charts, the pattern is especially significant, as it reflects stronger market sentiment than intraday noise.
Trading the Gravestone Doji Candle
The Gravestone Doji is best used as part of a broader trading setup:
- Wait for confirmation: A bearish candle following the Doji strengthens the case for a reversal.
- Use with key levels: The pattern gains reliability when it aligns with known resistance zones.
- Apply risk management: Many traders place stop-loss orders just above the high of the Gravestone Doji to limit risk.
- Combine with indicators: Tools such as RSI, MACD, or moving averages can confirm overbought conditions and reinforce the bearish outlook.
Risk Management in Practice
Like any candlestick pattern, the Gravestone Doji can produce false signals. Effective risk management is therefore essential. Position sizing, protective stops, and confirmation from other indicators help traders filter out noise. Volume analysis and multi-timeframe confirmation are also valuable in improving reliability.
Gravestone Doji vs Dragonfly Doji
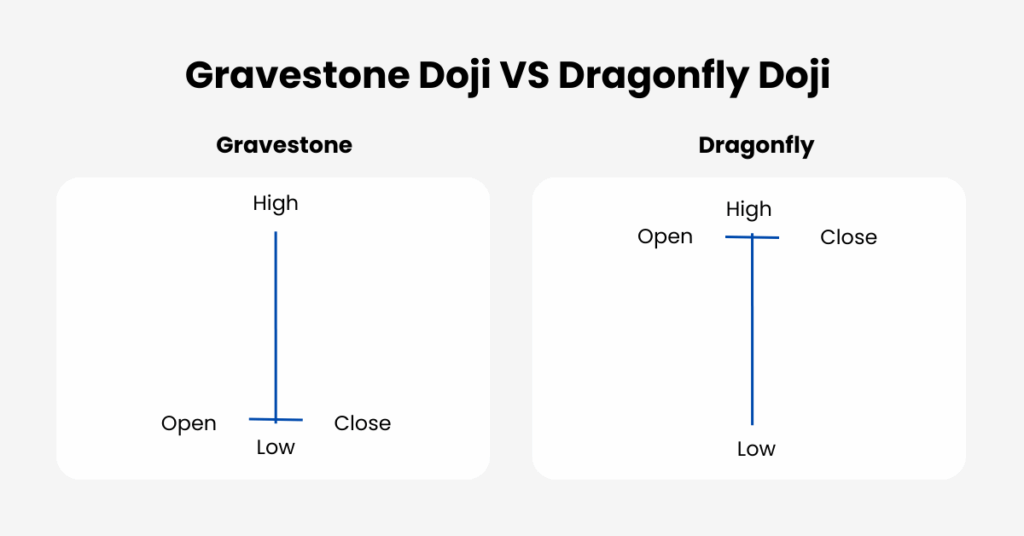
It is important not to confuse the Gravestone with its opposite, the Dragonfly Doji. While the Gravestone has a long upper shadow and suggests bearish sentiment, the Dragonfly has a long lower shadow and often signals a bullish reversal. Another similar-looking formation is the Shooting Star, but unlike the Gravestone, the Shooting Star has a small real body near the low of the candle. Recognising these differences prevents misinterpretation.
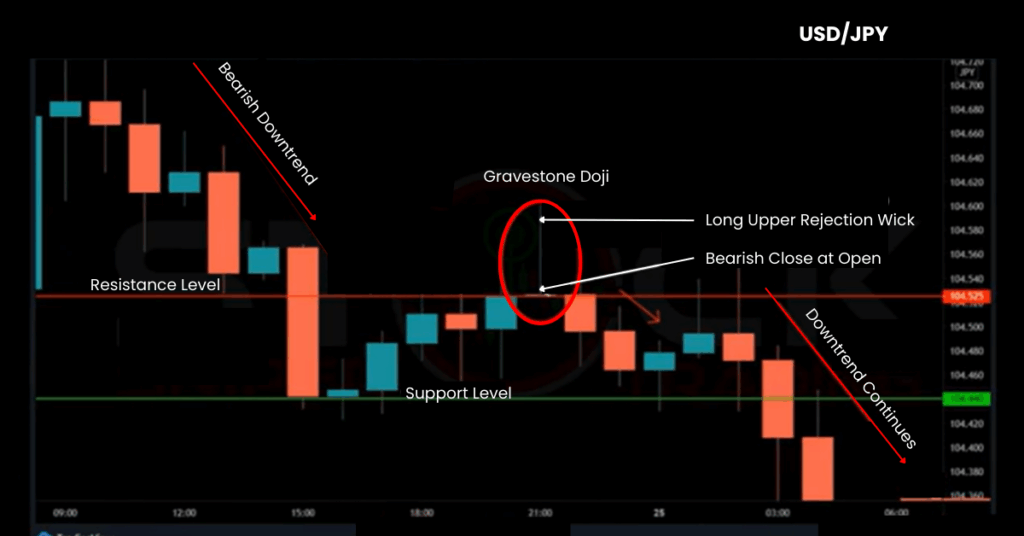
Example in Practice
On a USD/JPY hourly chart, traders observed a Gravestone Doji candle forming after a short-term rally in a larger downtrend. Buyers pushed the pair up to resistance, but sellers rejected the move, creating the inverted “T.” The following bearish candles confirmed the reversal as price broke lower, resuming the downtrend. This example shows how the Gravestone Doji can mark both major tops and the end of temporary pullbacks.
Limitations of the Gravestone Doji Candle
Despite its strong visual appeal, the Gravestone Doji candle is not a guarantee of reversal. In some cases, price continues higher after the pattern. The signal is most effective when supported by other tools such as resistance levels, trendlines, and momentum indicators. It is also less reliable in news-driven markets, where sudden volatility can overwhelm technical signals.
Key Takeaway
The Gravestone Doji candle is a clear warning of fading bullish pressure and growing seller dominance. Its appearance near resistance or at the top of a rally often signals a potential reversal, but traders should always confirm it with subsequent price action and supporting analysis. Combined with sound risk management, the Gravestone Doji remains one of the most valuable tools for spotting turning points in the market.
Disclaimer: This content is provided for informational purposes only and does not constitute, and should not be construed as, financial, investment, or other professional advice. No statement or opinion contained here in should be considered a recommendation by Ultima Markets or the author regarding any specific investment product, strategy, or transaction. Readers are advised not to rely solely on this material when making investment decisions and should seek independent advice where appropriate.
Latest Articles

FOLLOW US


Ultima Markets is a member of The Financial Commission, an international independent body responsible for resolving disputes in the Forex and CFD markets.
All clients of Ultima Markets are protected under insurance coverage provided by Willis Towers Watson (WTW), a global insurance brokerage established in 1828, with claims eligibility up to US$1,000,000 per account.
Ultima Markets is the first United CFD broker to be part of the United Nations Global Compact.
FOLLOW US
TRADE WITH US
RISK DISCLOSURE
Risk Warning:
Trading leveraged financial products, including Contracts for Difference (CFDs), carries a high level of risk and may result in losses exceeding your initial investment. These products are not suitable for all investors and should only be traded with funds you can afford to lose. You do not own or have any rights to the underlying assets of these derivatives (e.g., entitlement to dividends). Please ensure you fully understand the associated risks. Before trading, consider your level of experience, investment objectives, and seek independent financial advice if necessary. Refer to our legal documents and disclosures before making any trading decisions.
General Advice Warning:
The information provided on this website is general in nature and does not take into account your personal objectives, financial situation, or needs. Before acting on any advice, you should assess its appropriateness in light of your individual circumstances and consult our legal documentation.
Regional Restrictions:
The information and services on this website are not intended for residents of certain jurisdictions, including but not limited to the United States, Singapore, and any jurisdictions subject to international sanctions. For further information, please contact our customer support team.
Regulatory Information:
Ultima Markets is a trading name shared amongst multiple entities operating in various jurisdictions. These following entities are authorised to operate under the Ultima Markets brand and trademarks.
-
Ultima Markets UK Limited, reference number 470325, is authorised and regulated by the Financial Conduct Authority (FCA). Registered address: 1 Blossom Yard, Fourth Floor, London, E1 6RS, UNITED KINGDOM.
-
Ultima Markets Ltd is authorised and regulated by the Financial Services Commission (FSC) of Mauritius as a Full-Service Investment Dealer (excluding Underwriting), under licence number GB 23201593.
Registered address: 2nd Floor, The Catalyst, 40 Silicon Avenue, Ebene Cybercity, 72201, Mauritius.
Copyright © 2025 Ultima Markets Ltd. All rights reserved.
-

Messenger


Continue on Messenger
Take the conversation to your Messenger account. You can return anytime.
Scan the QR code and then send the message that appears in your Messenger.
Open Messenger on this device.
-

Instagram

Continue on Instagram
Take the conversation to your Instagram account. You can return anytime.
Scan the QR code to open Instagram. Follow @ultima_markets to send a DM.
Open Instagram on this device.
-

Live Chat
-
