Important Information
This website is managed by Ultima Markets’ international entities, and it’s important to emphasise that they are not subject to regulation by the FCA in the UK. Therefore, you must understand that you will not have the FCA’s protection when investing through this website – for example:
- You will not be guaranteed Negative Balance Protection
- You will not be protected by FCA’s leverage restrictions
- You will not have the right to settle disputes via the Financial Ombudsman Service (FOS)
- You will not be protected by Financial Services Compensation Scheme (FSCS)
- Any monies deposited will not be afforded the protection required under the FCA Client Assets Sourcebook. The level of protection for your funds will be determined by the regulations of the relevant local regulator.
Note: Ultima Markets is currently developing a dedicated website for UK clients and expects to onboard UK clients under FCA regulations in 2026.
If you would like to proceed and visit this website, you acknowledge and confirm the following:
- 1.The website is owned by Ultima Markets’ international entities and not by Ultima Markets UK Ltd, which is regulated by the FCA.
- 2.Ultima Markets Limited, or any of the Ultima Markets international entities, are neither based in the UK nor licensed by the FCA.
- 3.You are accessing the website at your own initiative and have not been solicited by Ultima Markets Limited in any way.
- 4.Investing through this website does not grant you the protections provided by the FCA.
- 5.Should you choose to invest through this website or with any of the international Ultima Markets entities, you will be subject to the rules and regulations of the relevant international regulatory authorities, not the FCA.
Ultima Markets wants to make it clear that we are duly licensed and authorised to offer the services and financial derivative products listed on our website. Individuals accessing this website and registering a trading account do so entirely of their own volition and without prior solicitation.
By confirming your decision to proceed with entering the website, you hereby affirm that this decision was solely initiated by you, and no solicitation has been made by any Ultima Markets entity.
I confirm my intention to proceed and enter this website

The 3 Black Crows Candlestick Pattern
In technical analysis, candlestick patterns are powerful tools for predicting price movements. One such pattern, the 3 Black Crows, stands out as a clear indicator of a bearish reversal. This pattern signals that a market that has been in an uptrend is likely to experience a downward shift, and it is crucial for traders to understand its formation, interpretation, and how it can be used effectively in trading strategies.
In this article, we will dive into the 3 Black Crows candlestick pattern, explore its components, how it is formed, and how traders can leverage it for better decision-making.

What is the 3 Black Crows Pattern?
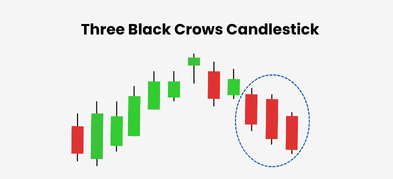
The 3 Black Crows is a bearish candlestick pattern that consists of three consecutive long, dark (or red) candlesticks. Each of these candles closes lower than the previous one, signaling strong selling pressure and a potential shift in market sentiment. The pattern usually appears after a significant uptrend, indicating that the market is losing momentum and a reversal to the downside is imminent.

For the pattern to be valid, it must meet the following criteria:
- Three Consecutive Bearish Candles: The three candlesticks must be long, indicating strong bearish momentum.
- Lower Lows: Each successive candle must close lower than the previous one, reinforcing the downward movement.
- Minimal or No Upper Shadows: The candles typically have little to no upper shadow, showing that the bears controlled the market throughout the trading session.
How the 3 Black Crows Pattern Forms
The pattern is most effective when it follows a strong bullish trend. Here’s how it typically unfolds:
- The Uptrend: The market has been rising steadily, driven by bullish sentiment. Prices are moving higher, and traders may begin to feel overly optimistic.
- First Bearish Candle: The first black crow opens at or near the top of the previous candle’s body and closes significantly lower. While this suggests some weakness, it isn’t enough to fully reverse the trend.
- Second Bearish Candle: The second black crow opens within the first candle’s body but closes lower, suggesting increasing bearish pressure. This marks the start of a potential trend reversal.
- Third Bearish Candle: The third candle closes even lower than the previous two, confirming that the bears have taken control. The close of the third candle below the low of the previous two solidifies the signal of a reversal.
Interpreting the 3 Black Crows Pattern
When traders spot the 3 Black Crows pattern, it suggests a shift in market sentiment. What was once a bullish market may now be turning bearish. Here’s how traders typically interpret the pattern:
- Bearish Reversal Signal: The appearance of three long bearish candles, each closing lower than the last, indicates that sellers have gained control. The buyers who were driving the previous uptrend are being overpowered.
- Market Exhaustion: After a prolonged uptrend, the pattern indicates that the buying pressure is running out of steam. The bears are starting to dominate the market, suggesting that the trend could soon reverse.
- Trend Confirmation: A significant drop in price following the completion of the 3 Black Crows pattern confirms that the reversal is likely to continue, and the market may enter a downtrend.
Real-World Example: Popmart Stock
A clear 3 Black Crows pattern can be observed in Popmart stock between February 22 and March 8, 2021. During this period, three consecutive long bearish candles appeared, each closing lower than the previous one. This pattern signaled a shift in market sentiment, indicating that the bullish momentum was losing steam, and the stock was likely to experience a downward reversal as sellers gained control.

How to Use the 3 Black Crows Pattern in Trading
While the 3 Black Crows pattern is a strong bearish signal, it is most effective when confirmed with other indicators and analysis. Here’s how traders can use it to their advantage:
- Short Positions: Traders often use the 3 Black Crows pattern to enter short positions. The pattern suggests that the price will continue to decline, and entering a short position at this point can be profitable.
- Confirm with Other Indicators: The reliability of the pattern increases when used in conjunction with other technical tools. For example:
- Volume: A rise in volume during the formation of the pattern suggests strong selling interest, confirming the bearish signal.
- Relative Strength Index (RSI): If the RSI is showing an overbought condition (above 70), the 3 Black Crows pattern becomes a more compelling reversal signal.
- Moving Averages: A crossover of short-term moving averages (e.g., 50-day) below long-term moving averages (e.g., 200-day) can add strength to the bearish signal.
- Key Support Levels: Watch for the 3 Black Crows to occur near key support levels. If the price breaks through these levels, the bearish trend could gain momentum, providing a solid entry point for short trades.
- Stop-Loss and Risk Management: As with any pattern, risk management is crucial. Traders can place a stop-loss just above the high of the third black crow to protect against false breakouts or reversal failures.
False Signals and Limitations
While the 3 Black Crows pattern can be a powerful signal, it is not foolproof. Here are some common pitfalls to be aware of:
- False Breakouts: Sometimes, the pattern may appear, but the price doesn’t continue lower. In such cases, the market may reverse back to the upside, catching traders off-guard.
- Weak Confirmation: If the pattern occurs in a sideways or weak uptrend, it may not be as reliable. It’s important to see the pattern after a strong trend for it to be valid.
- Market Context: Always consider the broader market context. Major news events or economic reports can influence price action and affect the reliability of the pattern.
Conclusion
The 3 Black Crows pattern is a potent bearish reversal signal that can help traders spot potential trend reversals. However, like all candlestick patterns, it should be used in conjunction with other technical indicators to confirm the signal. By combining this pattern with tools like volume, moving averages, and the RSI, traders can make more informed decisions and reduce the risk of false signals.
Recognizing the 3 Black Crows pattern early and acting on it with proper risk management can offer significant trading opportunities. Always remember to consider the broader market context and confirm the pattern with additional indicators to ensure a higher probability of success.
By mastering this pattern, traders can enhance their ability to spot market reversals and capture profitable moves in both trending and volatile markets.
Disclaimer: This content is provided for informational purposes only and does not constitute, and should not be construed as, financial, investment, or other professional advice. No statement or opinion contained here in should be considered a recommendation by Ultima Markets or the author regarding any specific investment product, strategy, or transaction. Readers are advised not to rely solely on this material when making investment decisions and should seek independent advice where appropriate.
Latest Articles

FOLLOW US


Ultima Markets is a member of The Financial Commission, an international independent body responsible for resolving disputes in the Forex and CFD markets.
All clients of Ultima Markets are protected under insurance coverage provided by Willis Towers Watson (WTW), a global insurance brokerage established in 1828, with claims eligibility up to US$1,000,000 per account.
Ultima Markets is the first United CFD broker to be part of the United Nations Global Compact.
FOLLOW US
TRADE WITH US
RISK DISCLOSURE
Risk Warning:
Trading leveraged financial products, including Contracts for Difference (CFDs), carries a high level of risk and may result in losses exceeding your initial investment. These products are not suitable for all investors and should only be traded with funds you can afford to lose. You do not own or have any rights to the underlying assets of these derivatives (e.g., entitlement to dividends). Please ensure you fully understand the associated risks. Before trading, consider your level of experience, investment objectives, and seek independent financial advice if necessary. Refer to our legal documents and disclosures before making any trading decisions.
General Advice Warning:
The information provided on this website is general in nature and does not take into account your personal objectives, financial situation, or needs. Before acting on any advice, you should assess its appropriateness in light of your individual circumstances and consult our legal documentation.
Regional Restrictions:
The information and services on this website are not intended for residents of certain jurisdictions, including but not limited to the United States, Singapore, and any jurisdictions subject to international sanctions. For further information, please contact our customer support team.
Regulatory Information:
Ultima Markets is a trading name shared amongst multiple entities operating in various jurisdictions. These following entities are authorised to operate under the Ultima Markets brand and trademarks.
-
Ultima Markets UK Limited, reference number 470325, is authorised and regulated by the Financial Conduct Authority (FCA). Registered address: 1 Blossom Yard, Fourth Floor, London, E1 6RS, UNITED KINGDOM.
-
Ultima Markets Ltd is authorised and regulated by the Financial Services Commission (FSC) of Mauritius as a Full-Service Investment Dealer (excluding Underwriting), under licence number GB 23201593.
Registered address: 2nd Floor, The Catalyst, 40 Silicon Avenue, Ebene Cybercity, 72201, Mauritius.
Copyright © 2025 Ultima Markets Ltd. All rights reserved.
-

Messenger


Continue on Messenger
Take the conversation to your Messenger account. You can return anytime.
Scan the QR code and then send the message that appears in your Messenger.
Open Messenger on this device.
-

Instagram

Continue on Instagram
Take the conversation to your Instagram account. You can return anytime.
Scan the QR code to open Instagram. Follow @ultima_markets to send a DM.
Open Instagram on this device.
-

Live Chat
-
