


Important Information
This website is managed by Ultima Markets’ international entities, and it’s important to emphasise that they are not subject to regulation by the FCA in the UK. Therefore, you must understand that you will not have the FCA’s protection when investing through this website – for example:
- You will not be guaranteed Negative Balance Protection
- You will not be protected by FCA’s leverage restrictions
- You will not have the right to settle disputes via the Financial Ombudsman Service (FOS)
- You will not be protected by Financial Services Compensation Scheme (FSCS)
- Any monies deposited will not be afforded the protection required under the FCA Client Assets Sourcebook. The level of protection for your funds will be determined by the regulations of the relevant local regulator.
Note: Ultima Markets is currently developing a dedicated website for UK clients and expects to onboard UK clients under FCA regulations in 2026.
If you would like to proceed and visit this website, you acknowledge and confirm the following:
- 1.The website is owned by Ultima Markets’ international entities and not by Ultima Markets UK Ltd, which is regulated by the FCA.
- 2.Ultima Markets Limited, or any of the Ultima Markets international entities, are neither based in the UK nor licensed by the FCA.
- 3.You are accessing the website at your own initiative and have not been solicited by Ultima Markets Limited in any way.
- 4.Investing through this website does not grant you the protections provided by the FCA.
- 5.Should you choose to invest through this website or with any of the international Ultima Markets entities, you will be subject to the rules and regulations of the relevant international regulatory authorities, not the FCA.
Ultima Markets wants to make it clear that we are duly licensed and authorised to offer the services and financial derivative products listed on our website. Individuals accessing this website and registering a trading account do so entirely of their own volition and without prior solicitation.
By confirming your decision to proceed with entering the website, you hereby affirm that this decision was solely initiated by you, and no solicitation has been made by any Ultima Markets entity.
I confirm my intention to proceed and enter this website

Support and Resistance Indicator Explained
In the world of trading, understanding price movements and trends is essential for success. One of the most commonly used tools to help traders navigate the markets is the Support and Resistance Indicator. Whether you’re a beginner or an experienced trader, understanding this indicator can provide valuable insights into market behaviour, allowing you to make more informed decisions and in turn, potentially increasing your profitability.
But what exactly is the support and resistance indicator, and how does it work? In this article, we’ll explore its definition, how it functions, and briefly touch on how you can use it in your trading strategy.
What is the Support and Resistance Indicator?
The Support and Resistance Indicator is a tool that helps identify critical price levels in the market. These levels are used to indicate where the price of an asset is likely to either reverse or face difficulty moving beyond, offering potential entry and exit points.
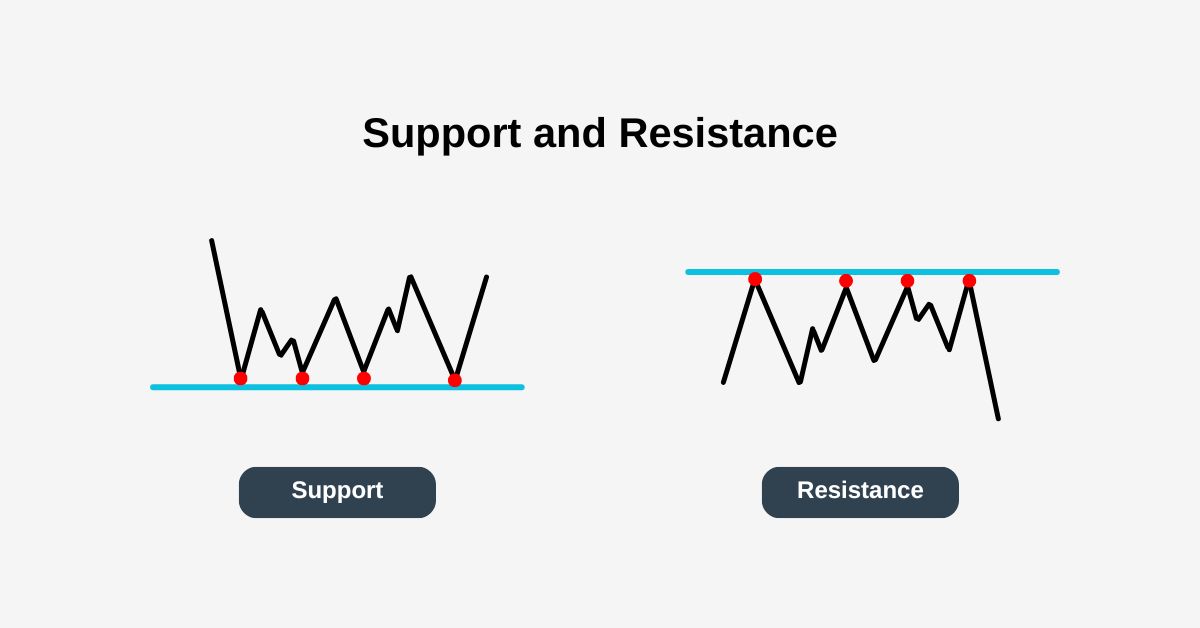
- Support refers to a price level where a downward trend is likely to pause or reverse. It’s the “floor” where demand is strong enough to prevent further price declines.
- Resistance refers to a price level where an upward trend is likely to halt or reverse. It acts as a “ceiling” where selling pressure outweighs buying interest.
These levels are often created by large buy or sell orders at specific price points, which can create significant barriers in the market.
Traders use these levels to forecast future price movements. The support and resistance indicator is vital for technical analysis, helping traders identify high-probability entry and exit points based on past price behaviour.
How Does the Support and Resistance Indicator Work?
The support and resistance indicator works by tracking historical price action and identifying key levels where prices have previously reversed or struggled to move beyond. These levels often indicate significant buying or selling interest.
- Support Level: When an asset’s price reaches a specific level and tends to bounce back up, this is identified as a support level. A price that approaches support may see more buyers entering the market, preventing further declines.
- Resistance Level: Conversely, when the price approaches a certain level and faces difficulty moving higher, that level is identified as resistance. Sellers often take control at resistance, pushing the price back down.
These levels are dynamic and can evolve over time. A strong support level may turn into resistance if the price breaks through it. Once this happens, the price often returns to retest the broken level, providing confirmation and new trading opportunities.
Identifying Support and Resistance Levels
There are various methods to identify support and resistance levels:
- Previous Price Action: Look for past price points where the asset has reversed direction or stalled. Multiple touches at a level reinforce its significance.
- Trend Lines: Drawing trend lines connecting the lows for support and the highs for resistance visually helps define these critical levels.
- Moving Averages: Moving averages are often used as dynamic support or resistance. A simple moving average can act as a support level, while an exponential moving average responds more quickly to recent price changes.
By identifying these levels and analysing them across different timeframes, traders can increase the reliability of these indicators.
The following Bitcoin chart shows how previous price action and trend lines can help identify key support and resistance levels:
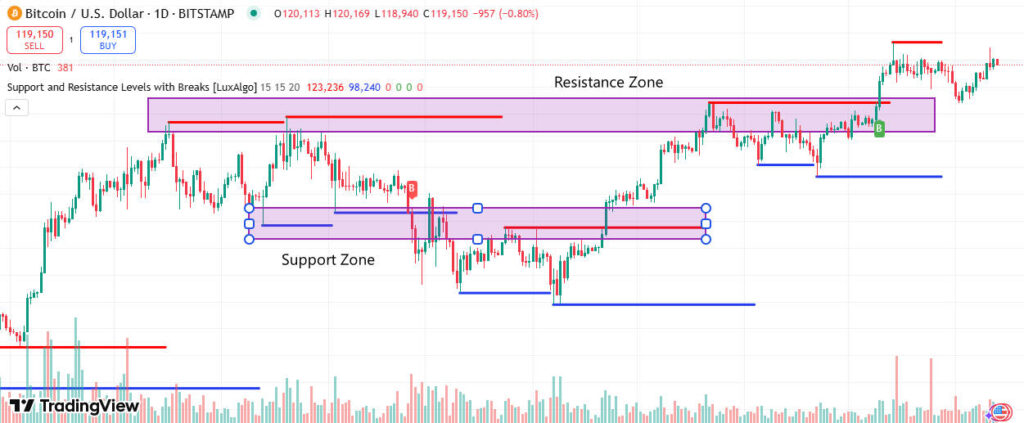
Resistance Zones and Price Break
Resistance Zones: Beyond Simple Levels
While individual resistance levels are important, experienced traders often focus on broader resistance zones. These zones are created when price repeatedly struggles to surpass a range of prices, forming a barrier. Resistance zones are significant, especially in trending markets. For instance, if a stock is in an uptrend and approaches a resistance zone created by both a previous high and a moving average, traders may anticipate a potential reversal or a bounce.
Recognising resistance zones allows traders to refine their strategies, improving entry and exit timing and better managing risk. Resistance indicators, such as moving averages and technical analysis tools like Fibonacci retracements, can help identify these zones more precisely.
Price Breaks: When Support and Resistance Fail
While support and resistance levels are essential, there are times when they fail, leading to price breaks. A price break occurs when the price moves beyond a support or resistance level, signaling a shift in market sentiment or a trend change.
Traders look for confirmation of price breaks using indicators like moving averages or the Relative Strength Index (RSI). For example, if the price breaks above resistance with strong volume and confirmation, it may signal a bullish trend, prompting a long position. Conversely, a break below support might signal a downtrend, prompting traders to sell or short.
How to Use the Support and Resistance Indicator in Trading
Once you’ve identified support and resistance levels, here’s how you can use them effectively:
- Setting Entry Points: Place buy orders near support, anticipating a price reversal. Similarly, sell orders can be placed near resistance, expecting a price decline.
- Stop-Loss and Take-Profit Placement: Set stop-loss orders just below support levels to protect against losses if the price breaks through. Similarly, place take-profit orders near resistance to lock in profits before potential price reversals.
- Trend Reversals: The support and resistance indicator can signal trend changes. A break through resistance could indicate a new uptrend, while a break below support may signal a downtrend.
- Confluence with Other Indicators: Combine the support and resistance indicator with other tools like RSI or MACD for confirmation, increasing the probability of successful trades.
Common Mistakes to Avoid
While the support and resistance indicator is a powerful tool, there are several common mistakes that traders make when using it:
- Ignoring Market Conditions: Support and resistance levels are not static and may change in different market conditions. Relying solely on these levels without considering the broader trend can lead to missed opportunities.
- Not Using Confirmation: Just because the price reaches a support or resistance level doesn’t guarantee a reversal. It’s essential to use additional confirmation from other indicators to ensure that the price will likely react at these levels.
- Overtrading: Some traders may place too many trades based on support and resistance levels. While these levels are important, it’s crucial to wait for confirmation and avoid chasing every price movement.
The Benefits of the Support and Resistance Indicator
The support and resistance indicator offers several advantages for traders:
- Clarity: It provides clear and visual price levels where market reversals are likely to occur.
- Risk Management: Support and resistance levels help traders manage risk by placing stop-loss and take-profit orders at strategic price points.
- Increased Precision: The indicator improves the precision of your trading decisions, helping to identify high-probability entry and exit points.
Conclusion
The support and resistance indicator is a fundamental tool for any trader’s technical analysis toolbox. By identifying key price levels, you can make more informed decisions, set better entry and exit points, and improve your overall trading strategy. Whether you’re a beginner or an experienced trader, understanding and utilising the support and resistance indicator can greatly enhance your trading success.
Ready to start using the support and resistance indicator in your trades? Explore advanced trading tools and strategies today with Ultima Markets and take your trading to the next level!
Disclaimer: This content is provided for informational purposes only and does not constitute, and should not be construed as, financial, investment, or other professional advice. No statement or opinion contained here in should be considered a recommendation by Ultima Markets or the author regarding any specific investment product, strategy, or transaction. Readers are advised not to rely solely on this material when making investment decisions and should seek independent advice where appropriate.
Latest Articles

FOLLOW US


Ultima Markets is a member of The Financial Commission, an international independent body responsible for resolving disputes in the Forex and CFD markets.

All clients of Ultima Markets are protected under insurance coverage provided by Willis Towers Watson (WTW), a global insurance brokerage established in 1828, with claims eligibility up to US$1,000,000 per account.
Ultima Markets is the first CFD broker to be part of United Nations Global Compact.
FOLLOW US
TRADE WITH US
RISK DISCLOSURE
Risk Warning:
Trading leveraged financial products, including Contracts for Difference (CFDs), carries a high level of risk and may result in losses exceeding your initial investment. These products are not suitable for all investors and should only be traded with funds you can afford to lose. You do not own or have any rights to the underlying assets of these derivatives (e.g., entitlement to dividends). Please ensure you fully understand the associated risks. Before trading, consider your level of experience, investment objectives, and seek independent financial advice if necessary. Refer to our legal documents and disclosures before making any trading decisions.
General Advice Warning:
The information provided on this website is general in nature and does not take into account your personal objectives, financial situation, or needs. Before acting on any advice, you should assess its appropriateness in light of your individual circumstances and consult our legal documentation.
Regional Restrictions:
The information and services on this website are not intended for residents of certain jurisdictions, including but not limited to the United States, Singapore, and any jurisdictions subject to international sanctions. For further information, please contact our customer support team.
Regulatory Information:
-
Ultima Markets is a trading name shared amongst multiple entities operating in various jurisdictions. These following entities are authorised to operate under the Ultima Markets brand and trademarks.
-
Ultima Markets UK Limited, reference number 470325, is authorised and regulated by the Financial Conduct Authority (FCA). Registered address: One Fleet Place, London, EC4M 7WS, United Kingdom.
-
Ultima Markets Ltd is authorised and regulated by the Financial Services Commission (FSC) of Mauritius as a Full-Service Investment Dealer (excluding Underwriting), under licence number GB 23201593.
Registered address: 2nd Floor, The Catalyst, 40 Silicon Avenue, Ebene Cybercity, 72201, Mauritius.
Copyright © 2025 Ultima Markets Ltd. All rights reserved.
-

Messenger


Continue on Messenger
Take the conversation to your Messenger account. You can return anytime.
Scan the QR code and then send the message that appears in your Messenger.
Open Messenger on this device.
-

Instagram

Continue on Instagram
Take the conversation to your Instagram account. You can return anytime.
Scan the QR code to open Instagram. Follow @ultima_markets to send a DM.
Open Instagram on this device.
-

Live Chat
-
