
Ultima Markets App
Trade Anytime, Anywhere
Important Information
This website is managed by Ultima Markets’ international entities, and it’s important to emphasise that they are not subject to regulation by the FCA in the UK. Therefore, you must understand that you will not have the FCA’s protection when investing through this website – for example:
- You will not be guaranteed Negative Balance Protection
- You will not be protected by FCA’s leverage restrictions
- You will not have the right to settle disputes via the Financial Ombudsman Service (FOS)
- You will not be protected by Financial Services Compensation Scheme (FSCS)
- Any monies deposited will not be afforded the protection required under the FCA Client Assets Sourcebook. The level of protection for your funds will be determined by the regulations of the relevant local regulator.
Note: Ultima Markets is currently developing a dedicated website for UK clients and expects to onboard UK clients under FCA regulations in 2026.
If you would like to proceed and visit this website, you acknowledge and confirm the following:
- 1.The website is owned by Ultima Markets’ international entities and not by Ultima Markets UK Ltd, which is regulated by the FCA.
- 2.Ultima Markets Limited, or any of the Ultima Markets international entities, are neither based in the UK nor licensed by the FCA.
- 3.You are accessing the website at your own initiative and have not been solicited by Ultima Markets Limited in any way.
- 4.Investing through this website does not grant you the protections provided by the FCA.
- 5.Should you choose to invest through this website or with any of the international Ultima Markets entities, you will be subject to the rules and regulations of the relevant international regulatory authorities, not the FCA.
Ultima Markets wants to make it clear that we are duly licensed and authorised to offer the services and financial derivative products listed on our website. Individuals accessing this website and registering a trading account do so entirely of their own volition and without prior solicitation.
By confirming your decision to proceed with entering the website, you hereby affirm that this decision was solely initiated by you, and no solicitation has been made by any Ultima Markets entity.
I confirm my intention to proceed and enter this website Please direct me to the website operated by Ultima Markets , regulated by the FCA in the United Kingdom

What is the Shanghai Stock Exchange Composite Index?
The Shanghai Stock Exchange Composite Index (commonly known as SSE Composite Index, SSE Index, or Shanghai Index, code: 000001) serves as a barometer of mainland China’s capital markets. It is not only the key benchmark for evaluating the overall performance of the Shanghai Stock Exchange but also a critical reference point for international capital seeking exposure to the Chinese economy.
Since the beginning of 2025, despite heightened volatility in global financial markets, the SSE Composite Index has shown remarkable resilience, reclaiming the 3,300-point level in early May. This reflects both the internal vitality of the Chinese economy and the effectiveness of macroeconomic policy interventions.
For investors, understanding the SSE Composite Index allows for deeper insight into China’s economic trends and provides opportunities for diversified asset allocation through related ETFs or cross-border investment instruments.
What Is the Shanghai Stock Exchange Composite Index?

The SSE Composite Index was officially launched by the Shanghai Stock Exchange on July 15, 1991. It includes all A-shares and B-shares listed on the exchange, excluding special treatment stocks (such as ST/*ST). The index is calculated using a weighted average method based on market capitalization, designed to reflect the performance of the overall market. The index traces its roots back to the trial “Shanghai Jing’an Index” developed in 1987 and has since witnessed multiple pivotal moments in the evolution of China’s capital markets over the past three decades.
As of May 12, 2025, the SSE Composite Index had a total market capitalization of RMB 64.05 trillion, with a free float ratio of 77.7%, underscoring its high level of market representation.
Composition and Characteristics of the SSE Composite Index
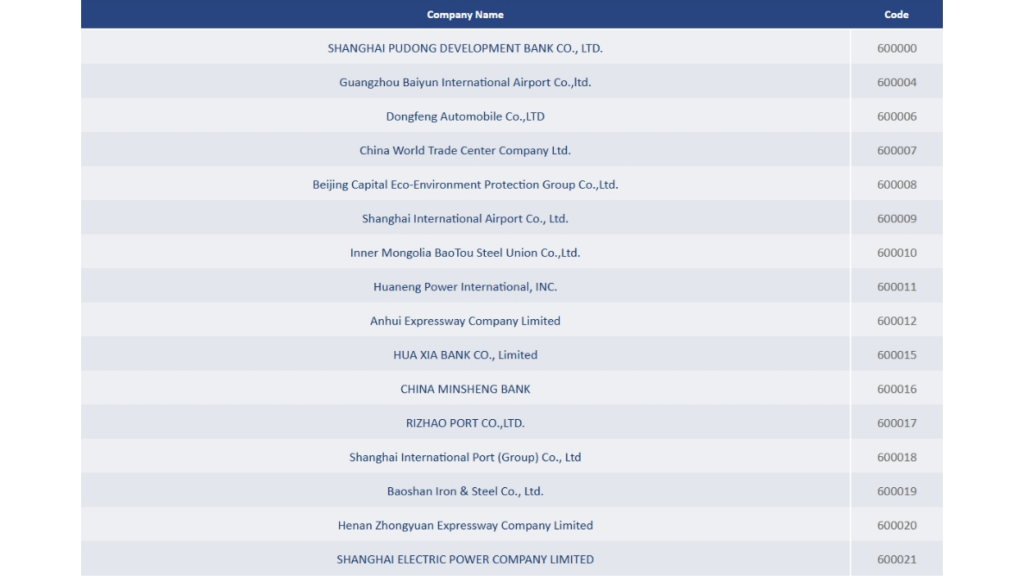
The SSE Composite Index includes over 1,500 listed companies spanning industries such as finance, energy, industrials, manufacturing, and technology. Due to its market capitalization-weighted methodology, large state-owned enterprises account for a significant portion of the index, making it more responsive to policy changes and macroeconomic developments. Compared with indices like the Shenzhen Component Index or CSI 300, the SSE Composite Index provides a broader and more comprehensive reflection of mainland China’s economic landscape.
*As of May 12, 2025
Calculation Formula
The specific calculation formula is:
Index at Reporting Period = (Total Market Cap of Constituents at Reporting Period ÷ Base Period Market Cap) × 100
This methodology leads to three key characteristics of the SSE Composite Index:
- Large-cap Dominance: As of April 2025, 12 listed companies with market capitalization over RMB 500 billion contributed to more than 30% of index volatility.
- High Policy Sensitivity: Heavily weighted stocks like state-owned banks and energy giants are highly responsive to macro policy changes.
- Sector Concentration Risk: The financial and real estate sectors have consistently accounted for over 30% of the index, amplifying the impact of shocks within these industries.
Correlation Between the SSE Composite Index and the Chinese Economy
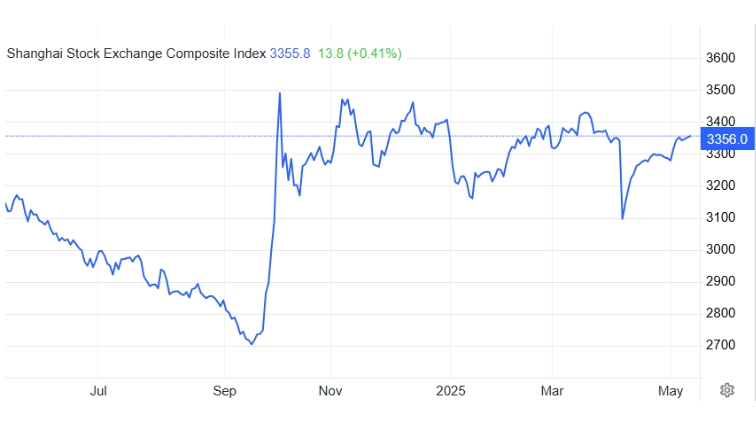
The SSE Composite Index is widely regarded as a barometer of the Chinese economy, with its performance often influenced by policy adjustments, RMB exchange rate fluctuations, capital flows, and geopolitical developments. In early 2025, although Beijing announced stimulus policies, the absence of concrete measures undermined investor confidence, resulting in a nearly 6% drop in January—marking the weakest start in nearly a decade.
In addition, uncertainty surrounding the U.S. administration’s new trade policies has further increased market volatility. Retail investors account for around 70% of trading volume in the Chinese stock market, and their sentiment plays a decisive role. The wave of sell-offs in early 2025 reflected widespread disappointment with economic policy, amplifying overall market instability.
Key Drivers of the SSE Composite Index
| Factor | Current Status | Potential Impact | Sensitive Sectors |
| Monetary Policy | Easing cycle (RRR cuts + rate cuts) | Positive | Finance, Real Estate |
| US-China Relations | Ongoing negotiations (tariff reductions likely) | Neutral to Bullish | Technology, Consumer |
| Industrial Policy | Strong support for digital economy & high-end manufacturing | Positive | IT, Industrial |
| Global Environment | Global slowdown, China remains relatively stable | Neutral | Energy, Materials |
| Technical Pattern | Consolidation in the 3,300–3,400 range | Awaiting breakout | Broad-based |
How Can Investors Monitor and Track the SSE Composite Index?

For investors, gaining exposure to the Shanghai Stock Exchange Composite Index not only helps diversify regional risk, but also allows participation in the rewards of China’s economic transformation. In the 2025 market environment, we recommend focusing on the following four practical strategies:
- ETFs and Funds: Invest in broad-based traditional ETFs, thematic enhanced ETFs, or mutual funds that offer exposure to Chinese equities.
Notably, the leading Securities ETF (560090) does not directly track the SSE Composite Index, but it includes 50 listed brokerages, all of which are major index constituents. It has gained 39.59% over the past six months, making it a quality proxy for index exposure. Investors without access to mainland brokerage accounts can consider feeder funds such as Class A (501047) and Class C (501048).
- CFD Trading: Use platforms like Ultima Markets to trade CFDs related to the SSE Composite Index and capture market opportunities with flexibility.
- Technical Analysis Tools: Use MT4/MT5 platforms along with technical indicators and charting tools to interpret market trends.
- Economic Calendars and News: Monitor China’s official economic indicators such as GDP, CPI, and PMI, along with key policy announcements to stay in sync with market sentiment.
How to Participate in SSE Composite Index Trends via Ultima Markets
While the SSE Composite Index itself is not directly tradable, investors can gain exposure through Ultima Markets via the following channels:
- CFD Trading on Chinese ADRs: Trade CFDs on major Chinese ADRs such as Alibaba, Baidu, and China Construction Bank, whose performance is closely correlated with the SSE Composite Index.
- ETF CFDs: Trade ETFs like FXI and ASHR that track the A-share market, allowing for indirect exposure to the SSE Composite Index’s movements.
- Commodity and Currency Pair Strategies: Engage in trading instruments like USD/CNH, gold, or China copper futures, which are tightly linked to the Chinese economy.
Ultima Markets offers the following advantages:
- High Leverage: Up to 1:2000, enhancing capital efficiency.
- Tight Spreads and Instant Execution: Reduce trading costs and improve efficiency.
- Multi-Platform Support: Compatible with MT4/MT5 and proprietary mobile apps for trading anytime, anywhere.
- Fund Security: Client funds are segregated and covered by a €20,000 compensation fund through the Financial Commission.
- Demo Account: Offers a simulated trading environment for investors to practice and get familiar with market operations.
Outlook and Investment Opportunities for the SSE Composite Index
According to global macro models by Trading Economics, the SSE Composite Index is projected to reach 3,285.36 by the end of Q2 2025, with a 12-month target of 3,181.09. However, Liang Xing, Head of Quantitative Investment at Cathay Pacific Fund, notes that while the A-share market may remain volatile in 2025, there will likely be structural opportunities, particularly in AI, gaming, autonomous driving, robotics, and semiconductor-related sectors.
Additionally, Zhongyuan Securities highlights that the current price-to-earnings ratio of the SSE Composite Index is 14.24x, which is around the median of the past three years, making it suitable for mid- to long-term allocation. Policy optimization and undervaluation remain the key attractions, with regulators expected to continue implementing proactive fiscal policy and prudent monetary policy to foster a supportive environment for capital markets.
Conclusion
Looking ahead to the second half of 2025, as China’s economy gradually recovers (with a projected GDP growth rate of 4.8%) and corporate earnings improve, the SSE Composite Index is expected to trend upward within the 3,200–3,800 point range. Investors should maintain a cautiously optimistic outlook, focusing on stocks with Q3 earnings surprises and policy-driven thematic opportunities. Participating in this phase of capital market transformation offers the potential to share in China’s high-quality long-term growth dividends.
Disclaimer: This content is provided for informational purposes only and does not constitute, and should not be construed as, financial, investment, or other professional advice. No statement or opinion contained here in should be considered a recommendation by Ultima Markets or the author regarding any specific investment product, strategy, or transaction. Readers are advised not to rely solely on this material when making investment decisions and should seek independent advice where appropriate.
Latest Articles


FOLLOW US


Ultima Markets is a member of The Financial Commission, an international independent body responsible for resolving disputes in the Forex and CFD markets.
All clients of Ultima Markets are protected under insurance coverage provided by Willis Towers Watson (WTW), a global insurance brokerage established in 1828, with claims eligibility up to US$1,000,000 per account.
Ultima Markets is the first United CFD broker to be part of the United Nations Global Compact.
FOLLOW US
TRADE WITH US
RISK DISCLOSURE
Risk Warning:
Trading leveraged financial products, including Contracts for Difference (CFDs), carries a high level of risk and may result in losses exceeding your initial investment. These products are not suitable for all investors and should only be traded with funds you can afford to lose. You do not own or have any rights to the underlying assets of these derivatives (e.g., entitlement to dividends). Please ensure you fully understand the associated risks. Before trading, consider your level of experience, investment objectives, and seek independent financial advice if necessary. Refer to our legal documents and disclosures before making any trading decisions.
General Advice Warning:
The information provided on this website is general in nature and does not take into account your personal objectives, financial situation, or needs. Before acting on any advice, you should assess its appropriateness in light of your individual circumstances and consult our legal documentation.
Regional Restrictions:
The information and services on this website are not intended for residents of certain jurisdictions, including but not limited to the United States, United Kingdom, Singapore, and any jurisdictions subject to international sanctions. For further information, please contact our customer support team.
Regulatory Information:
Ultima Markets is a trading name shared amongst multiple entities operating in various jurisdictions. These following entities are authorised to operate under the Ultima Markets brand and trademarks.
-
Ultima Markets UK Limited, reference number 470325, is authorised and regulated by the Financial Conduct Authority (FCA). Registered address: 1 Blossom Yard, Fourth Floor, London, E1 6RS, UNITED KINGDOM.
-
Ultima Markets Ltd is authorised and regulated by the Financial Services Commission (FSC) of Mauritius as a Full-Service Investment Dealer (excluding Underwriting), under licence number GB 23201593.
Registered address: 2nd Floor, The Catalyst, 40 Silicon Avenue, Ebene Cybercity, 72201, Mauritius.
Copyright © 2026 Ultima Markets Ltd. All rights reserved.
-

Messenger


Continue on Messenger
Take the conversation to your Messenger account. You can return anytime.
Scan the QR code and then send the message that appears in your Messenger.
Open Messenger on this device.
-

Instagram

Continue on Instagram
Take the conversation to your Instagram account. You can return anytime.
Scan the QR code to open Instagram. Follow @ultima_markets to send a DM.
Open Instagram on this device.
-

Live Chat
-
